Along with the interest and growth in creative placemaking is a concomitant
interest in measuring and communicating accomplishments of those efforts and
sharing good practices among creative placemaking practitioners. Toward this
end, funders, researchers, and other interested parties are developing methods of
measuring impact and identifying what information (e.g., indicators) to collect to measure
progress toward a goal. The National Endowment for the Arts (NEA), for example, developed
a set of creative placemaking indicators to enable practitioners and other stakeholders
to better identify and understand potential outcomes of their efforts and how they might be
communicated.2 Similarly, ArtPlace America identified an initial set of 10 Vibrancy Indicators
intended to help assess its investment in creative placemaking and learn more about the
contributions of arts activities to creative placemaking.3 Indicators have also been developed
for some local creative placemaking projects.4
Identifying these indicators is not without challenges because creative placemaking
efforts often have multiple and varying goals, such as increasing employment, reducing
crime, and attracting or retaining residents. Community context also affects the appropriateness
of particular indicators. For example, crime rates may not be considered particularly
useful as indicators for communities that generally have little crime. Thus, multiple
indicators are needed. In addition, considerable debate exists among arts researchers and
practitioners about which indicators are best aligned with and able to measure benefits of
creative placemaking efforts.5 Despite these challenges, managers and funders of creative
placemaking initiatives are interested in identifying and using indicators to help determine
whether outcomes of interest are moving in the desired direction.
The Validating Arts and Livability Indicators Study
The NEA sponsored the Urban Institute’s Validating Arts and Livability Indicators
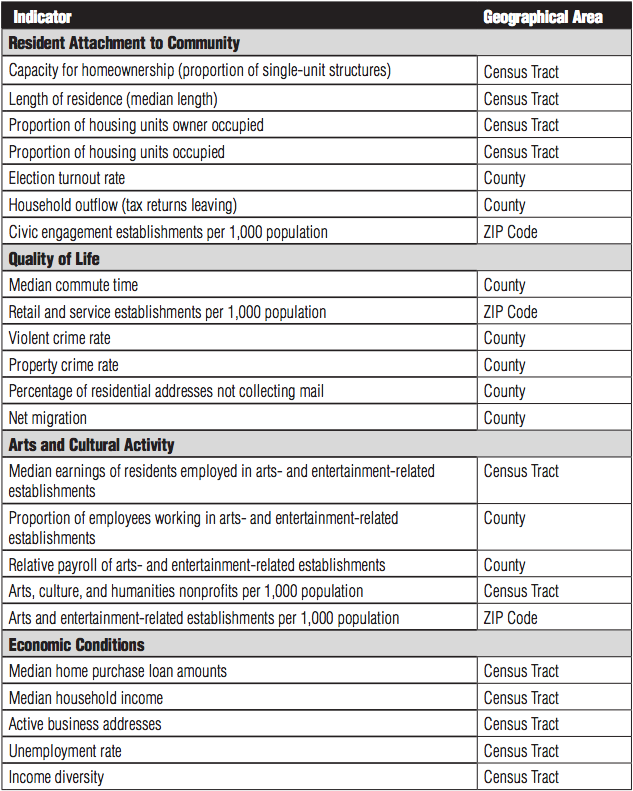
(VALI) Study from fall 2012 to spring 2014 to validate a set of 23 potential indicators.6 The
NEA selected indicators to reflect four key dimensions of livability: resident attachment to
community, quality of life, arts and cultural activity, and economic conditions. The NEA
identified multiple indicators for each dimension (Table 1). It chose indicators by reviewing
goals of applicants for NEA funding and by reviewing relevant research. The NEA chose
only indicators for which data are available from national, publicly available sources, such as
the US Census Bureau’s County Business Patterns data to avoid the need for practitioners
to rely exclusively on local sources, which may not always exist, or to collect their own data,
which can be expensive and time-consuming. Publicly reported data establishes reasonably
reliable indicators of changes in a community’s livability. Although creative placemaking
efforts are not the only cause of changes in publicly reported data values, such changes
could be examined in combination with local or project-specific data to better understand
a creative placemaking project’s effects. In addition, changes in indicator values could be a
starting point for more rigorous project evaluation.7
The VALI study sought feedback about the suitability of the indicators for two purposes:
to reflect livability conditions and, separately, as outcome indicators specific to local creative
placemaking efforts. Researchers conducted site visits and held a convening to obtain feedback
from approximately 80 participants involved in creative placemaking from 10 Our Town
grantee communities.8 (For more on the NEA’s Our Town grants, see Chu and Schupbach in
this issue.) Urban and rural sites were equally represented in the study. Participants provided
feedback by reviewing community-specific maps and bar charts based on indicator data and
also discussed indicators conceptually (independent of numeric values). Participants represented
approximately 50 organizations, including arts and cultural organizations, community
or neighborhood organizations, and businesses and local government agencies. The study
also included a focus group with five practitioners or researchers with expertise in community
development and indicators who were not directly involved in creative placemaking.
Table 1
NEA Candidate Indicators for the Arts and Livability
Reactions to the Indicators
Participants approached this study with more interest than expected. They were very
engaged with the indicators and local data validation activities throughout the process. Many
asked thoughtful questions, challenged assumptions, and offered alternative proposals. Their
responses suggested an appetite for measuring the impact of creative placemaking efforts.
This was particularly evident at the convening of four Our Town grantees—two rural and
two urban communities. Each community had two representatives—one from an arts-related
partner agency, the other from a government partner agency. The mixture of perspectives,
evident in both full-group and small-group discussions, provided a particularly rich exchange
of ideas. Often, such “buy in” is absent and measurement activities are primarily viewed in
the context of grant compliance and less often in the context of program improvement.
Key findings from the VALI Study (the report is available on the NEA and Urban Institute
websites) include the following:9
- Participants viewed most of the indicators as representative of their respective livability dimensions. Some exceptions included single-unit housing structures (representing capacity
for homeownership) and election turnout rates as signals of community attachment;
and home purchase loan amounts and a measure of income distribution (Gini coefficient)
as indicators of economic conditions. - Less consensus existed on the validity of indicators as measures of creative placemaking project
contributions. Participants had mixed or less favorable reactions to a greater number
of indicators when they considered using them to reflect their own project’s intended
outcomes. Less favorable were single-unit housing structures and election turnout
rates (resident attachment to community), and median commute time (quality of
life). Several indicators, including crime rates, household income, and unemployment
rates received mixed ratings. Given the relatively small size and scope of many
creative placemaking efforts in the context of the larger community, many participants
believed these projects could not have much effect on these indicators. - Community context matters. The communities selected to participate in this study were
diverse in many ways, including age of community; geographic region; population
(age, size, density); project type (e.g., arts infrastructure, cultural district development,
festivals and engagement); and project objectives. These and other characteristics
appeared to affect perceptions of indicators, particularly their appropriateness
as creative placemaking indicators. For example, individuals representing an urban or
rural area often expressed different views about the same indicator (e.g., crime rates).
However, when the responses were aggregated among all communities, these differences
tended to be more muted. - Geographic scope of indicators is a principal concern. Study participants often raised
concerns about using indicator data reported in large geographic areas (e.g., county
crime rates) to reflect changes in smaller areas where creative placemaking projects
typically focus efforts (e.g., neighborhoods). However, participants considered data
reported for these larger areas useful in providing context for other indicators.
Looking Ahead
The VALI study showed that most respondents viewed the indicators as relevant within
their respective livability dimensions. However, participants viewed some indicators as less
strongly relevant for measuring the contribution of individual creative placemaking efforts.
Most participants viewed the set of indicators as a reasonable place to start, but many also
thought that additional indicators and tools were needed to effectively communicate individual
program or collective community effects. These findings suggest a two-part agenda.
The first part should address identifying the most appropriate measures. The second should
focus on how best to develop the capacity of creative placemaking organizations to capture
and report on their contributions to individuals and communities. We offer the following
suggestions:
Taxonomy of Outcomes
Build on the efforts of NEA, ArtPlace America, and others in the field by assembling a
working group to develop and gradually refine a taxonomy of outcomes to capture the individual
and collective contributions of creative placemaking efforts. Efforts such as the Cultural Data
Project—or the more recent effort by Grantmakers in the Arts to establish a National Standard
Taxonomy on Support for Individual Artists10—could guide development of such a classification
structure. The taxonomy of cultural vitality indicators, developed by Maria Rosario Jackson
and colleagues, could also offer guidance.11 A distinguishing factor of this suggestion is emphasis
on outcomes for individuals and community rather than a set of indicators that largely captures
inputs and resources supporting arts activities. The four livability dimensions are a start, but
other dimensions, such as education, health, and diversity (sometimes noted as gaps by study
participants) could be readily added. Initially, this taxonomy could be an inventory of indicators
currently available and in use, but it could quickly evolve to build a menu or wish list of desirable
indicators currently unavailable or untested.
Creative Placemaking Monitoring and Evaluation Peer Network
The VALI Study revealed considerable interest in indicators, data sources, and data
collection techniques. Creating a forum for various stakeholders to continue to engage in these and other topics could support creative placemaking activities and better measurement
opportunities. The National Neighborhood Indicators Partnership, as an example of a
network, sponsors a listserv enabling participants to share resources, post research inquiries,
or share ideas about current or best practices. Depending on the size, scope, and interest of
a potential creative placemaking community of interest, participants could work together to
solve problems with gaps in research, data collection strategies, and methods. Such a network
could be established with relatively low overhead, but choosing a sponsor or moderator for
the network may require more consideration.
Repository of Tools and Approaches for Evaluating Creative Placemaking
Although the size and scale of creative placemaking activities vary considerably, many
projects have limited capacity and resources to undertake measurement or evaluation activities.
Finding a place to post sample community surveys, local strategies for obtaining less
commonly available data elements, or case studies would shorten the learning curve for
many communities. The repository could include links to publicly available resources, with
new links added as they become available. Materials could include case studies, such as the
NEA’s recently released e-storybook of case studies and lessons learned from Our Town
grantees;12 studies or guidance documents on indicators; and data sets or descriptions of
data sets, such as those available from local indicator projects in some communities.13 VALI
Study researchers identified several projects that may have indicators relevant to creative
placemaking. The NEA expects to provide this information in 2015.
Research Partnerships
Data collection and evaluation capacity concerns of local creative placemaking projects
may also be addressed by encouraging partnerships with local universities or communitybased
groups. The advantages of such partnerships, in many cases, is to offer low-cost support
beyond what may be possible with limited funding for most local creative placemaking
efforts. Depending on the type of data collection activity, it may be possible for partners to
help engage residents (e.g., recent retirees) in conducting in-person community surveys or
participating in focus groups to obtain data on a variety of community outcomes unlikely to
be available to national, regional, or local administrative data sources.
We believe advancement on any of these fronts would lead to a broader menu of indicators,
data collection strategies, and, ultimately, better data in support of creative placemaking
efforts.
1. The described study received support from the NEA. The views expressed are those of the authors and should
not be attributed to the Urban Institute, its trustees, its funders, or the NEA.
2. The NEA does not expect all grantees to use all of its indicators. Rather, they are intended as resources to be
used where applicable. For more information, see Sunil Iyengar, “Taking Note: Learning Is the New Word for
Evaluation,” Art Works Blog, May 8, 2014, https://www.arts.gov/art-works/2014/taking-note-learning-new-word-evaluation.
3. For more information on the ArtPlace America indicators and their use, see “Vibrancy Indicators” at
http://www.artplaceamerica.org/vibrancy-indicators/; and “ArtPlace America Metrics FAQ” at http://www.artplaceamerica.org/artplace-metrics-faq/
4. See, for example, indicators developed for Minneapolis’ creative placemaking effort focused on Hennepin Avenue: Anne Gadwa Nicodemus, “Track-It Hennepin 2012: Baseline Indicators and Data Roadmap”
December 2012; and pp 10-24 of Appendices to “Plan-It Hennepin: Creative Placemaking for Downtown
Minneapolis,” http://hennepintheatretrust.org/sites/default/files/user/email/plan-it_appendices.pdf.
5. Ann Markusen, “Creative Cities: A 10-Year Research Agenda,” Journal of Urban Affairs 36 (S2) (2014): 567–589.
6. E. Morley, M. K. Winkler, S. Zhang, R. Brash, J. Collazos, “The Validating Arts and Livability Indicators
(VALI) Study: Results and Recommendations,” (Washington, DC: National Endowment for the Arts, 2014),
https://www.urban.org/research/publication/validating-arts-livability-indicators-vali-study.
7. J. Schupbach and S. Iyengar, “Our View of Creative Placemaking, Two Years In,” November 27, 2012, http://createquity.com/2012/11/our-view-of-creative-placemaking-two-years-in.html; and J. Schupbach, “Creative
Placemaking—two years and counting!” May 31, 2012, https://www.arts.gov/art-works/2012/creative-placemaking-two-years-and-counting.
8. Anne Gadwa Nicodemus, who served as an advisor to this study, facilitated portions of this day-long convening.
9. Elaine Morley et al, “The Validating Arts and Livability Indicators (VALI) Study: Results and
Recommendations,” http://arts.gov/sites/default/files/VALI-Report.pdf.
10. Alan Brown et al, “A Proposed National Standard Taxonomy for Reporting Data on Support for Individual
Artists,” (Seattle, WA: Grantmakers in the Arts, 2014), https://www.giarts.org/article/support-for-individual-artists-research-initiative.
11. Maria Rosario Jackson et al, “Cultural Vitality In Communities: Interpretation and Indicators,” (Washington,
DC: Urban Institute, 2006), http://www.urban.org/publications/311392.html.
12. The National Endowment for the Arts, “Exploring Our Town,” http://arts.gov/exploring-our-town/
13. The Boston Indicators Project is a well-known example. It includes a section of indicators on cultural life and
the arts. See http://www.bostonindicators.org/.
Elaine Morley, PhD, is a senior research associate in the Urban Institute’s Metropolitan Housing and
Communities Policy Center. She has more than 25 years of experience in performance measurement and in conducting evaluations of a wide variety of programs. As part of the Urban Institute’s Public
Management Program, she has participated in projects addressing performance measurement practices
for nonprofit organizations and for federal, state and local government entities. She has contributed to
numerous publications on performance measurement for such entities, including guides for practitioners.
She received a PhD in social science from Syracuse University.
Mary Kopczynski Winkler is a senior research associate with the Center on Nonprofits and Philanthropy
at the Urban Institute. Since coming to the Urban Institute in 1995, Ms. Kopczynski Winkler
has been actively involved in various projects focused on strategic planning and assistance in the development
of performance measurement systems for government agencies and nonprofit programs. In addition
to her work with the NEA to validate indicators of community livability for creative placemaking, Ms.
Kopczynski Winkler was principal investigator for the Urban Institute’s work with OPERA America
and five major national arts service organizations to develop a system for building the research and
analysis capacity for the performing arts. Ms. Kopczynski Winkler graduated from Bryn Mawr College
and has an MPA from American University. She is also an accomplished accordionist.