U.S. productivity growth surged in the latter half of the 1990s after nearly two decades of lackluster gains. Several states in the West were among the leaders in this productivity growth surge, posting average annual increases well above the rest of the U.S.
- Productivity surge stronger in the District
- Broad-based surge, focused advantage
- How important is IT?
- Conclusion
- References
Regional Report. The Regional Report appears on an occasional basis. It is prepared under the auspices of the Financial and Regional Analysis Section of the FRBSF’s Economic Research Department.
U.S. productivity growth surged in the latter half of the 1990s after nearly two decades of lackluster gains. Several states in the West were among the leaders in this productivity growth surge, posting average annual increases well above the rest of the U.S. In the last Economic Letter (2002-33), Dan Wilson examined the District’s productivity performance advantage in terms of the level of output per worker. This Economic Letter documents the recent productivity performance in terms of growth rates and examines the sectors contributing to the West’s exceptional surge. The results show that, as in the nation, productivity growth in the District accelerated in most regions and sectors. In terms of outperforming the rest of the nation, however, much of the credit goes to the relatively rapid productivity growth in sectors related to information technology (IT).
Productivity surge stronger in the District
From 1995 to 2000, output per worker in the U.S. grew at an average annual rate of about 2.8%, well above the 1.5% per year pace recorded from 1973 to 1995. A large literature links this surge to improvements in producing and using IT goods and services (Oliner and Sichel 2002; Stiroh 2002). Less well-studied is the extraordinary surge of productivity growth in the West, where both the pace of growth and the acceleration in growth exceeded that of the rest of the nation.

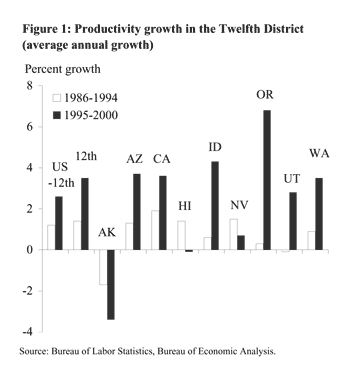
The magnitude of the West’s advantage is illustrated in Figure 1, which shows average annual growth in productivity (measured as real value-added per worker) in the Twelfth District and the rest of the nation from 1986-1994 and 1995-2000 (see Wilson 2002 for a detailed description of the measurement of regional productivity; 1986 is the first year in which these data are reliable). As the figure indicates, in the earlier period, productivity growth in the District about matched that in the nation. But from 1995 through 2000, productivity grew much faster in the District—3.5%—than in the rest of the nation—2.6%. Furthermore, during the latter period, the exceptional performance was widespread, with six of the nine District states outpacing the average for the rest of the U.S. Among these six states, average annual productivity growth ranged from 6.8% in Oregon to 2.8% in Utah. In contrast to the trends in the rest of the District and the nation, productivity growth slowed in Alaska, Hawaii, and Nevada during this period.
Another way to consider the exceptional productivity growth rates in the District is to compare the increase between the periods 1986-1994 and 1995-2000. By this measure, productivity growth in the District jumped by 2.1 percentage points, while in the rest of the nation the jump was 1.5 percentage points. Ranked by the magnitude of the productivity acceleration across periods, the District included five of the top eleven states in the nation—Oregon (1st), Idaho (2nd), Utah (4th), Washington (9th), and Arizona (11th). Other states in the top ten list included Minnesota, North Dakota, North Carolina, Colorado, New Hampshire, and South Dakota.
One factor contributing to the faster acceleration of productivity growth in the District was the shift in certain District states from low-wage, resource-based industries, like logging and wood processing, to high-wage sectors, like IT manufacturing and software development. The impact of these shifts is evident in Figure 1, as states that made the shift—Oregon, Idaho, and Utah—also showed the most pronounced accelerations in productivity growth. In Oregon, productivity growth increased from an average annual rate of 0.3% from 1986-1994 to 6.8% from 1995-2000, a jump of 6.5 percentage points. The jumps in Idaho and Utah also were large—3.8% and 2.9%, respectively.
Broad-based surge, focused advantage

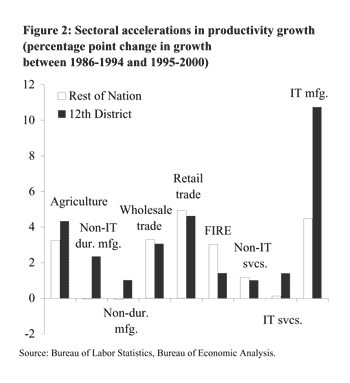
A great deal of the productivity acceleration in the U.S. in recent years appears to be due to improvements in producing IT services and goods. But, as Figure 2 shows, the gains have not been limited to IT services (which includes business services) and IT manufacturing (which includes industrial machinery and equipment, electronics, communications equipment, and instruments and related products). Rather, the productivity surge was broad-based in both the District and the rest of the nation. This supports the many anecdotes about rapid improvements in efficiency associated with increased and better use of IT in sectors as diverse as agriculture and retail trade.
For example, in keeping with reports of technology-driven improvements in genetic engineering and crop management, agricultural productivity increased sharply during 1995-2000, rising by 3.2 percentage points outside of the District and 4.3 percentage points in District states. Rapid accelerations in productivity growth also were recorded in wholesale and retail trade, where investments in IT equipment and software helped firms better manage inventories, access customers, and maintain records. Gains in these sectors were roughly the same in the District and the rest of the nation. Only mining, construction, and transportation, communications, and public utilities (not shown) recorded declines in productivity relative to the previous period.
Productivity gains between the two periods were more regionally varied in the finance, insurance, and real estate (FIRE) sector. Outside the District, they increased by 3 percentage points on an annual average basis, about the same jump as wholesale trade, but within the District they jumped by only 1.4 percentage points. Again, gains in productivity in FIRE are consistent with anecdotal reports of the computerization of banking, investment, and real estate markets. The District outperformed the rest of the U.S. in the non-IT durable manufacturing and non-durable manufacturing sectors.
As expected, productivity growth also jumped in IT services and IT manufacturing, especially in the District. Productivity growth in District IT services increased by 1.4 percentage points to a 3.3% average annual rate of growth, while in the rest of the nation, it rose only slightly. In keeping with rapid technological advancement in the production of semiconductors and computers, productivity growth in IT manufacturing surged in the latter half of the 1990s, especially in the Twelfth District. Outside the District, average annual productivity growth accelerated by about 4.5 percentage points between the two periods, and within the District, it doubled.
This analysis helps answer two questions: Is the productivity surge in the District sustainable? And will the District continue to outperform the rest of the nation? The answer to the first question appears to be “yes.” Because the District’s productivity surge occurred across a wide variety of industries, this suggests that the District’s productivity surge does not hinge on the performance of just one sector, a fact likely to increase the probability that it will be sustainable. The answer to the second question appears to be less positive. That is, it is less likely that the District’s productivity growth will continue to outperform the rest of the nation’s because the star performers—agriculture, durable and nondurable manufacturing, IT manufacturing and IT services—constitute a limited set of industries.
While data limitations make it difficult to assess accurately the contributions of IT use on District productivity growth, it is possible to examine the impact of IT-producing sectors on the pickup in District productivity growth and on the region’s strong performance relative to the nation.
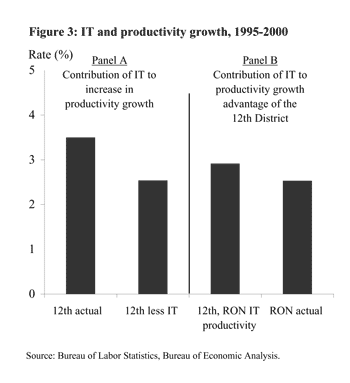
A simple way to estimate the impact of the IT sector on District productivity growth is to remove the IT sector from the productivity growth calculation and compare the result to the actual. The way to examine the importance of IT-producing sectors on the District’s productivity advantage is to assign the productivity growth rate in IT for the rest of the nation to the District and compare the result to the actual.

Panel A of Figure 3 addresses the first point. It shows that, absent the IT sector, average annual productivity growth in the District for the period 1995-2000 would have been about 1 percentage point below the actual value—2.5% instead of 3.5%. By this measure, about one-third of the District’s productivity surge is due to rapid gains in the IT sector. Although measured differently, this is about the same contribution Stiroh (2002) finds for IT-producing sectors. This exercise implies that, absent the IT sector, the District’s productivity growth advantage in the latter half of the 1990s would be eliminated, with gains again mirroring those in the rest of the U.S.
Panel B of Figure 2 addresses the second point. The first bar shows what District productivity growth would have been if its IT-producing sectors had experienced productivity growth comparable to the rest of nation. Erasing the relatively rapid productivity growth in District IT sectors reduces but does not eliminate the District’s overall productivity advantage for the period. In this scenario, District productivity would have averaged 2.9% instead of the actual 3.5%. Thus the IT sector accounted for 0.6 percentage points (two-thirds) of the 0.9 percentage point productivity growth gap between the District and the rest of the nation during the period 1995 through 2000. The remaining advantage is due to the more rapid productivity growth in other sectors, including agriculture and non-IT manufacturing.
The U.S. economy’s remarkable surge in productivity growth since the mid-1990s was especially strong in the Twelfth District. Relatively rapid productivity growth in recent years stretched the District’s long-standing productivity level advantage and boosted profits and wages across the region. Looking forward, the broad-based nature of the District’s productivity surge across sectors and states suggests that the more rapid growth trend is unlikely to be derailed by disruptions in a single industry or weakness in a single state. At the same time, with so much of the District’s extraordinary performance concentrated in a few industries, especially IT, its productivity growth advantage is more vulnerable, particularly in the current IT climate.
Mary Daly
Research Advisor
References
Oliner, S., and D. Sichel. 2002. “Information Technology and Productivity: Where Are We Now and Where Are We Going?” Federal Reserve Board FEDS Paper 2002-29.
Stiroh, K. Forthcoming. “Information Technology and the U.S. Productivity Revival.” American Economic Review.
Wilson, D. 2002. “Productivity in the Twelfth District.” FRBSF Economic Letter 2002-33 (November 8).
Opinions expressed in FRBSF Economic Letter do not necessarily reflect the views of the management of the Federal Reserve Bank of San Francisco or of the Board of Governors of the Federal Reserve System. This publication is edited by Anita Todd and Karen Barnes. Permission to reprint portions of articles or whole articles must be obtained in writing. Please send editorial comments and requests for reprint permission to research.library@sf.frb.org