As more and more people use computers at home, at work, and at school, researchers have found that computer use has important implications for our material well-being. One finding, for example, is that people who use computers in the workplace tend to earn higher wages than those who do not, and available evidence suggests that this reflects, at least in part, the direct impact of skills that are associated with or acquired through computer use.
- Who uses computers?
- Does the Twelfth District have an edge in computer use?
- Is there a “digital divide”? Yes and no
- References
As more and more people use computers at home, at work, and at school, researchers have found that computer use has important implications for our material well-being. One finding, for example, is that people who use computers in the workplace tend to earn higher wages than those who do not, and available evidence suggests that this reflects, at least in part, the direct impact of skills that are associated with or acquired through computer use. In addition, some research has attributed a significant portion of the acceleration in U.S. productivity gains in the mid-1990s to the diffusion of computer technology throughout the workplace; therefore, differential computer use across states may help explain productivity growth differences across states.
In this Economic Letter, we use a special data set on computer use to assess whether there is a “digital divide.” In particular, we look for substantive differences in computer use across population groups and states (focusing the latter on the Twelfth District) and we discuss what the implications of such differences might be.
Our study uses the Computer and Internet Use Supplement to the government’s monthly Current Population Survey (CPS) conducted in September 2001; the CPS surveys about 60,000 households and provides information on employment and unemployment. The computer use supplements ask respondents about computer and Internet use at home, work, and school. Our primary sample consists of 116,457 individuals age 3 and above; our subsample focusing on computer use in the workplace consists of 60,868 individuals.
Our tabulations indicate that computer use in the U.S. is quite widespread, with 54.5% of the population age 3 and older using computers at home, the same percent of workers using computers at work, and 84.8% of children age 17 and under (attending school) using computers in school. For the entire sample, 67.5% used computers through one or more of these sources, up from 43.0% in 1989, due to increases for all major population groups (our 2001 figures differ slightly from those in a related study by the U.S. Department of Commerce 2002, because our sample includes only those for whom we also have data on other key variables, such as income).
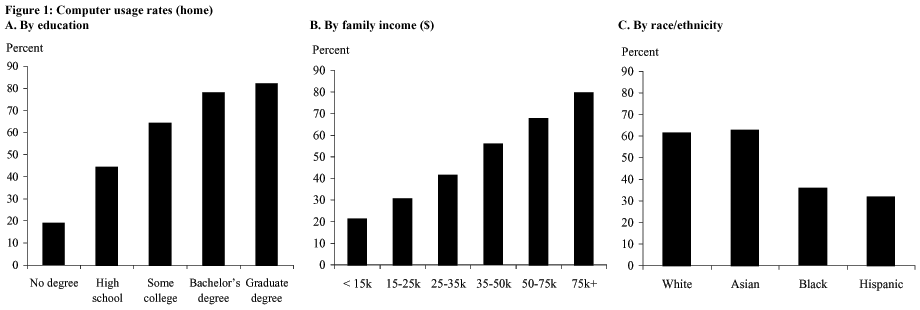
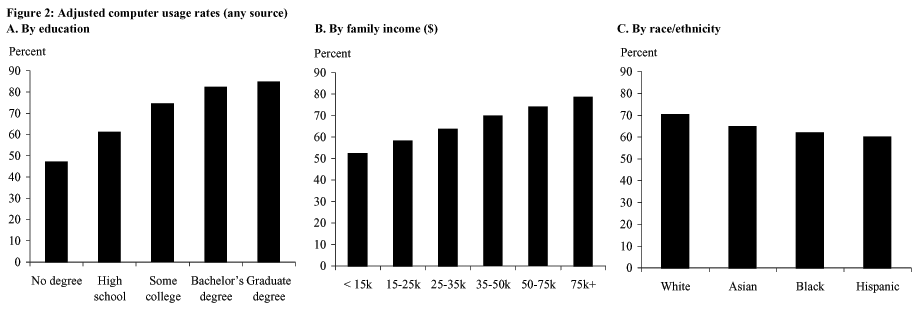
Despite the widespread diffusion of computers, the level of usage varies dramatically by educational levels, family incomes, and racial backgrounds. Figures 1 and 2 illustrate these differences in computer use rates based on two different comparisons. Figure 1 shows rates of computer usage at home based purely on a breakdown of the sample by the indicated variable. Figure 2 shows rates of computer usage from any measured source (home, work, and school), as adjusted by a regression model. Because access at school and work is likely to be less dependent on family income than is use at home, such access is likely to exert an equalizing influence on differences in relative usage between high-income and low-income groups (see U.S. Department of Commerce 2002). We take the additional step of using a regression model that adjusts for differential use by age, race, sex, education, marital status and number of children, family income, and geographic area (state and urban/rural), which allows us to isolate the independent contributions of these factors.


Our analyses show that educational attainment is the key determinant of computer use (Figure 1, Panel A; for children under 18, the household head’s educational attainment is used). Home computer use ranges from 18.9% for those with no high school degree to 81.9% for those holding graduate degrees. The adjusted results in Figure 2 (Panel A) show that even after accounting for work and school use and controlling for family income and other factors, a significant portion of the educational gap in computer use remains. An individual with a bachelor’s degree is 35.0 percentage points more likely to use a computer than someone who never finished high school and 21.0 percentage points more likely to use a computer than someone with just a high school degree. The disparity is only slightly larger (2.5 percentage points) for those with graduate degrees.
Family income also is an important determinant of computer use. The unadjusteddifferences in Figure 1 (Panel B) are large. The usage rate is 21.1% for individualswith family income under $15,000 per year and 79.6% for individuals with familyincome of at least $75,000 per year. Incorporating use at work and school, andaccounting for other factors that affect the likelihood of computer use, substantiallyreduces the differentials across income groups (Figure 2, Panel B). In particular,in the regression framework the disparity is less than half that in the unadjustedfigures. This means that over half of the unadjusted differences across incomegroups (from Figure 1) are caused by other factors that are correlated with higherincome (especially educational attainment). In this adjusted framework, individualsfrom the highest-income families are 26.2 percentage points more likely to usecomputers (from any source) than are individuals from the lowest-income families;this is noticeably smaller than the spread based on educational differences (37.5percentage points).
Substantial differences in computer use also are evident among racial and ethnicgroups (Panel C of Figures 1 and 2). In the unadjusted data, while 61.2% of whitesand 62.7% of Asians use computers at home, only 35.7% of blacks and 31.6% ofHispanics do. Accounting for use at work and school, and controlling for otherdeterminants of computer use, substantially reduces the usage gap between whites/Asiansand blacks/Hispanics. Relative to computer use rates for whites, the disparityin use rates for blacks and Hispanics drops from 25.5 and 29.6 percentage points,respectively, to 8.4 and 10.4 percentage points. In the general population Asianshave a slightly higher rate of computer usage at home than whites, but controllingfor other factors shows that, all else equal, Asians are 5.5 percentage pointsless likely to use computers at home, work, or school.
Does the Twelfth District have an edge in computer use?
To explore this question, we focus on computer use at work, which has been identified as a potentially important contributor to productivity levels and growth. For the regression analyses, we add to the previous set of variables a set of controls for industry of employment, which accounts for differences in computer use across states that are due to differences in industrial structure (based on 23 separate industry categories).
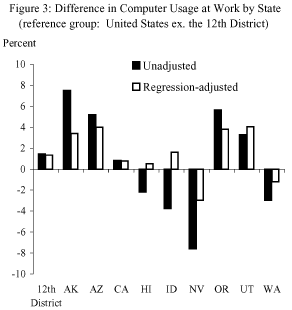
 Figure 3 lists work computer use differentials for the Twelfth District, measured relative to the rest of the nation. Our unadjusted tabulations show that Twelfth District states on average have only slightly higher rates of computer use at work than the rest of the U.S. in 2001. The gap is 1.5 percentage points, and it is little changed when we incorporate other determinants of computer use at work.
Looking at the Twelfth District states individually, we find that California and Washington, two states regarded as being at the forefront of the IT revolution, exhibit approximately equal or lower rates of computer use than the U.S. outside the District. In those states’ major tech centers-the San Francisco Bay Area and Seattle-the rates of computer use at work are about 7 to 8 percentage points above that in the U.S. outside the District, on an unadjusted basis. However, these usage gaps fall essentially to zero after accounting for differences in related factors such as income and educational levels (not displayed). These 2001 figures reflect a change for Seattle: additional tabulations (not shown) indicate that in 1997 Seattle’s rate of computer use at work was substantially above that in the U.S. outside the District (14.8 percentage points on an unadjusted basis, 7.6 percentage points on an adjusted basis), but during the subsequent four years the rest of the nation caught up.
As of 2001, however, some of the Twelfth District states did exhibit significantly higher rates of work computer use than the U.S. outside the Twelfth District. In particular, Alaska, Arizona, Oregon, and Utah exhibit rates of work computer use about 3½ to 4 percentage points above the average outside the District, while work use in Nevada is a bit below the average outside the District. Alaska’s edge may be due in part to the state’s relatively high transportation costs, which can be mitigated through computer connectivity, while the economies of Arizona, Oregon, and Utah appear to have some unique features that encourage workplace computer use.
Is there a “digital divide”? Yes and no
The “digital divide” in the U.S. is based on differential computer use across education, income, and race/ethnicity groups. In the extreme, a Hispanic individual with a high school degree or less and family income less than $15,000 per year has only a 30.6% chance of using a computer (at home, work, or school), compared to a 93.8% chance for a white person with a graduate degree and family income over $75,000 per year. Accounting for the independent effects of these and other factors indicates that college education is the key determinant of computer use, although substantial gaps are evident across income categories and, to a lesser extent, racial/ethnic groups as well. Moreover, additional tabulations with 1997 data (not displayed) indicate that, in percentage point differences, these gaps have been relatively stable over time (although they are likely to shrink as computer prices fall further and usage rates for some groups approach the limit of 100%).
In regional terms, however, there is little evidence of a “digital divide” between the Twelfth District and the rest of the country, once factors such as education, family income, and industrial composition are accounted for. The small cross-state differences in computer use at work are consistent with Daveri and Mascotto’s (2002) findings that productivity growth gaps across states in the 1990s are explained much more by the concentration of IT production activities in the state than by the use of computers at work. On the other hand, several Twelfth District states-notably Arizona, Oregon, and Utah-exhibit relatively high rates of computer use at work. To the extent that computer use has a causal link to productivity, these states may enjoy a payoff in the form of the higher salaries associated with computer use on the job.
Rob Valletta
Research Advisor
Geoffrey MacDonald
Research Associate
References
[URLs accessed December 2003.]
Daveri, Francesco, and Andrea Mascotto. 2002. “The IT Revolution across the U.S. States.” Working paper, University of Parma.
U.S. Department of Commerce. 2002. “A Nation Online: How Americans Are Expanding Their Use of the Internet.” Report (February).
Opinions expressed in FRBSF Economic Letter do not necessarily reflect the views of the management of the Federal Reserve Bank of San Francisco or of the Board of Governors of the Federal Reserve System. This publication is edited by Anita Todd and Karen Barnes. Permission to reprint portions of articles or whole articles must be obtained in writing. Please send editorial comments and requests for reprint permission to research.library@sf.frb.org