The payment landscape has changed dramatically in recent years as new technologies have been brought to market. Yet, the demand for U.S. currency—cold, hard cash—shows no sign of fading. An empirical analysis indicates that alternative payment technologies have tended to keep cash growth in check, but other factors have more than offset this. Over the next 10 years, cash volume is projected to grow 1.7% per year.
Over the past few decades, the dominant position of cash as a store of value and a means of payment has increasingly been challenged. The growth of electronic payments, especially credit cards and, more recently, debit cards, has radically changed the role of cash in the global economy. Yet, the circulation of the U.S. dollar, the world’s most widely used currency, has continued to grow without interruption. Last year, the value of U.S. currency in circulation reached nearly $1 trillion dollars. That enormous stock of cash consisted of almost 30 billion Federal Reserve notes spread to every corner of the globe.
As the nation’s central bank, the Federal Reserve is responsible for maintaining a safe and efficient payment system. Cash plays a critical role in that system. As the agency that officially issues U.S. currency, the Federal Reserve has a vital interest in understanding what determines the demand for currency and where demand is likely to go in the years to come. One way to understand the demand for currency is to examine the Fed’s cash processing volumes. This Economic Letter considers what has determined those volumes over the past 35 years and estimates the future direction of cash use. Alternative payment technologies have tended to limit cash growth, but other factors have more than offset this restraint. Our baseline projection is that over the next 10 years the value of the Fed’s shipments of cash to the banking system will grow 1.7% per year.
Background and history of U.S. cash volumes
To understand what determines U.S. cash volume and how cash demand affects that volume, it is useful to consider why the use of currency grows or shrinks, and how cash volume has changed in recent decades. Each one of the nearly 30 billion Federal Reserve notes currently in circulation was shipped early in its life as a new bill from a Federal Reserve office. Many bills eventually found their way back to a Federal Reserve office, in some cases several times, where they were checked for quality and legitimacy. Counterfeits and dirty or worn notes were removed, while notes in good shape were returned to circulation along with new bills.
The Fed considers shipments of acceptable used bills and new bills to be cash “payments” by the Fed to depositories, which are banks, thrifts, and similar financial institutions. The depositories receive these payments for one of two reasons: either as exchanges for used cash these institutions send to the Fed for processing, known as Fed cash receipts; or as new cash they order to meet customer demand. The value of new cash supplied to depositories is deducted from the deposit accounts these institutions maintain with the Fed. This additional cash adds to currency in circulation. Of course, depositories could order less cash than the value they send to the Fed for processing, which would cause currency in circulation to fall. The amount of cash that the Fed pays out in a given year is the sum of the cash banks send to the Fed that is returned to circulation and the economy’s need for additional currency, manifested as the cash demand of depository customers.
Figure 1
FRB payments and currency in circulation (average)

Source: Federal Reserve Cash Product Office, authors’ calculations.
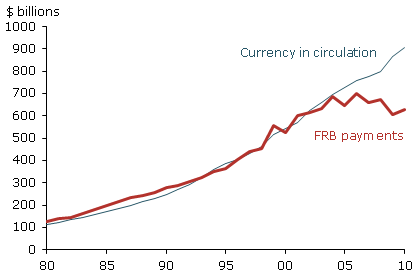
Figure 1 shows aggregate U.S. currency in circulation and annual gross Fed shipments of cash since 1980. Two observations are noteworthy. First, currency in circulation has grown around a steady trend with minimal fluctuations throughout this period. Despite dramatic changes in the payment landscape over the past 30 years and the recent financial crisis and recession, cash holdings among households, businesses, and banks have continued to grow at a steady pace. Second, around 2005 and 2006, the Fed’s gross shipments of cash began to diverge sharply from currency in circulation. Cash shipments fell steeply, while currency in circulation continued to grow. In other words, banks sharply reduced the value of cash they sent to the Fed for processing, but continued to order more new cash than they returned, so that currency in circulation grew. The divergence between Fed cash shipments and currency in circulation was probably due to a recirculation policy that the Fed instituted in 2006 to discourage banks from overusing the Fed’s free cash-processing service. The policy applied specifically to $10 and $20 notes. Indeed, the steep drop in cash volumes was unique to those two denominations, according to data on cash receipts and payments by denomination.
Historical analysis
An empirical analysis of the determinants of aggregate U.S. cash volumes over the past 30 years, that is, gross payments of cash from the Fed, can be used to forecast cash volumes over the next 10 years. To forecast cash volumes, we create a model in which gross payments are a function of factors that affect either Fed cash receipts from depositories or currency in circulation. Some factors, such as Fed processing and shipping fees, may only affect demand for Fed cash processing services. Other factors, such as foreign demand for $100 notes as a store of value, may only affect public demand for U.S. currency. Still other factors, such as the total number of payment transactions in the economy, may affect both demand for processing and new currency.
Projecting the long-term outlook for cash volume implies different empirical approaches than those used to forecast short-term trends, which the statistics and econometrics literature tends to concentrate on. The long-term model-based exercise carried out here is akin to the exercise the Congressional Budget Office (CBO) performs to forecast economic variables such as GDP, inflation, and the federal budget deficit in its “Economic Outlook” series (see CBO 2011). The “Economic Outlook” projections are based on an empirical model of how key economic aggregates affect each other and how they are affected by various external factors. We use historical data in our cash volume model to generate a baseline projection and then consider alternative simulations. As with the CBO’s long-term empirical model, this method is mainly useful for examining the important forces affecting the long-term outlook and the key factors that could cause actual trends to deviate from the forecast.
Figure 2
Projected annual cash payment volumes

Source: Federal Reserve Cash Product Office, authors’ calculations.
We first estimate the demand for Fed cash payments using historical data from 1974 through 2009. Specifically, we perform a regression, a statistical exercise correlating the Fed’s gross cash payments with a set of explanatory variables. These variables include macroeconomic conditions, such as growth, inflation, and interest rates; changes in the use of payment technologies, such as ATMs, checks, credit cards, debit cards, and electronic transfers; and Fed cash policies. We also control for regular monthly variations in demand for cash. We find that the proliferation of ATMs has increased overall demand for cash, while the growing use of alternative payment technologies has restrained cash demand. We also find that various Fed cash policies have had significant effects on cash volume. Surprisingly, we find that economic conditions have very little effect
on cash volume. The results of our statistical exercise indicate that our model fits the historical movements of Fed cash payments quite well.
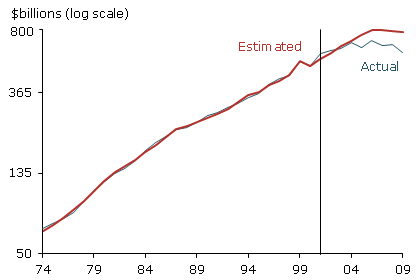
To test the predictive power of this empirical model, we perform a second regression, this time using data only through 2001. We then examine data from our set of explanatory variables from 2002 to 2009 to generate cash payment forecasts for the years following our 1974–2001 sample. The red line in Figure 2 shows the model’s predicted values for the 1974–2001 in-sample period and out-of-sample predicted values for the 2002–2009 period. The blue line shows historical Fed cash payments data, which are the same as the red line in Figure 1. The model results fit the data for the 1974–2001 in-sample period very closely and also predict the cash-payment movements during the 2002–2009 out-of-sample period relatively well.
Baseline projection and alternative simulations
Figure 3
Simulations of annual cash demand, 2010 to 2020

Source: Federal Reserve Cash Product Office, authors’ calculations.
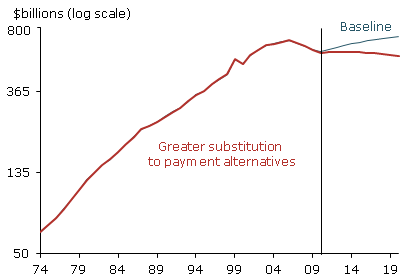
Next, we use the regression results for the full 1974–2009 period and projections for the explanatory variables to prepare a baseline forecast of Fed cash payments to 2020. As values for the economic growth and inflation variables, we use CBO projections (CBO 2011). We assume interest rates over the next 10 years will be around their 2001–2009 average levels. We generally assume that all other variables will continue to grow at their 2001–2009 average trend through 2020. The baseline projection, shown as the blue line in Figure 3, is for an 18% increase in the aggregate value of gross payments between 2010 and 2020, equal to growth of 1.7% per year.
Finally, we use the model to carry out an alternative simulation of future cash volumes. In this exercise, we assume that consumer adoption of non-cash payment technologies, such as debit and credit cards, grows over the next 10 years at double the growth rate of the past 10 years, and hence double the rate used to generate our baseline projection. This simulation represents some combination of adoption of existing payment alternatives at an increased pace and growth of new or emerging payment technologies, such as mobile payments. The alternative simulation results are shown by the red line in Figure 3. In this scenario, cash payments fall significantly short of our baseline forecast, moving sideways over the next decade rather than continuing on their historical upward trend.
Conclusion
The payment landscape has changed dramatically in recent years. Many new and exciting payment technologies have been brought to market and more are in development. Yet, overall demand for cash shows no sign of slowing. This trend will probably continue over the next 10 years. At the same time though, that rapid diffusion of alternative payment methods could potentially displace cash more than we project in our baseline forecast. However, the unique attributes of cash, such as the anonymity it offers payers and its appeal as a back-up store of value, mean that currency is likely to play an important role in the nation’s payment system for some time to come.
Reference
Congressional Budget Office. 201. “Budget and Economic Outlook: Fiscal Years 2011 to 2021.”
Opinions expressed in FRBSF Economic Letter do not necessarily reflect the views of the management of the Federal Reserve Bank of San Francisco or of the Board of Governors of the Federal Reserve System. This publication is edited by Anita Todd and Karen Barnes. Permission to reprint portions of articles or whole articles must be obtained in writing. Please send editorial comments and requests for reprint permission to research.library@sf.frb.org