Commodity prices have soared several times in recent years, raising concerns that overall inflation could rise substantially. However, crops, oil, and natural gas make up only about 5% of the cost of U.S. consumer goods and services. Thus, about one percentage point of the 10% cumulative inflation since 2007 reflects price rises in these important commodity categories. When the contribution of these commodities is subtracted from overall inflation, the resulting pattern is remarkably similar to that of core inflation, which excludes food and energy prices.
Commodities such as metals, oil, natural gas, and agricultural products have gone through unprecedented price swings over the past five years. These fluctuations have caused large movements in overall inflation and may have spilled over to core inflation, which excludes food and energy prices.
In this Economic Letter, which updates results from Hobijn (2008), we calculate the commodity share of U.S. personal consumption expenditures (PCE), which is the total outlay for consumer goods and services estimated by the Commerce Department’s Bureau of Economic Analysis from the same data used to calculate gross domestic product. This share can be traced back to the cost of raw commodities used to produce consumer goods and services. We focus on the two most important commodity categories: energy and agricultural crops. After we determine the cost shares of energy and crops, we calculate how much these commodities have contributed to price increases since January 2007.
PCE cost shares of energy and crops
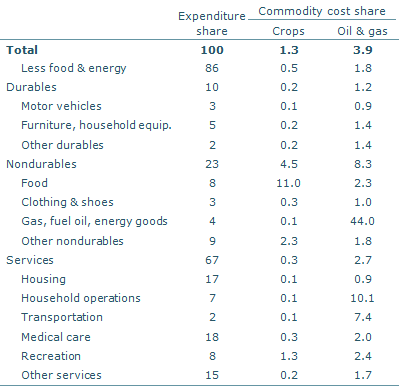
Table 1
Commodity cost shares by PCE category (reported as %)

Sources: Authors’ calculations based on 2008 input/output matrix from the Bureau of Labor Statistics (2010) and 2010 national accounts data.
How much of the price of consumer goods and services consists of energy and crop costs? To answer this question, we trace these commodities along the U.S. supply chain for the production of goods and services. We use input-output tables published by the Bureau of Labor Statistics (2010) to derive estimates of the fraction of product costs that commodities represent, following Hale and Hobijn (2011). We focus on two commodity categories: crops, and oil and gas. We select them because the share in the PCE of all other categories, such as metals, is very small. The crops category consists of fruits and melons, fresh and dried vegetables, nuts, grains, raw cotton, hay, hayseeds, and oilseeds. The oil and gas category includes crude petroleum and natural gas.
For our analysis, we combine 2010 PCE data with the 2008 BLS input-output tables, the most recent available. The year 2008 was the peak for real commodity prices, meaning that in 2008 the relative value of commodities was at its highest. Therefore, our estimates of the share of commodities in PCE can be viewed as an upper bound. These estimates are slightly higher than those in Hobijn (2008), which were based on 2006 input-output tables.
Table 1 shows cost shares of crops and oil and gas by consumption expenditures subcategories and the shares of these subcategories in PCE. Oil and gas are important for energy-related expenditures, such as fuel, transportation, and household operations, which include utilities. Crop costs mostly show up in the food subcategory. Outside these areas, commodity-related inputs make up a small part of consumer spending costs. Oil, natural gas, and crops represent around 5% of total consumer expenditures. Of that, oil and natural gas are primary, contributing 3.9 percentage points.
Recent movements in commodity prices
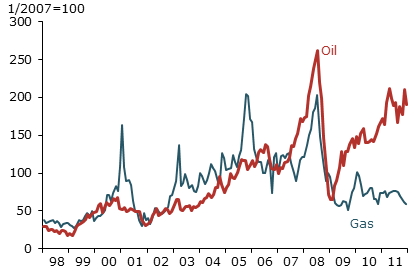
Figure 1
Producer prices for oil and gas: 1998-2011

Source: Bureau of Labor Statistics (BLS).
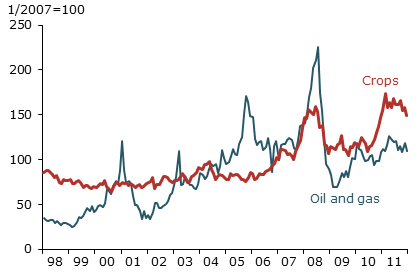
Figure 2
Producer prices of commodity inputs in IO tables

Sources: BLS and authors calculations.
To account for the weight of commodity price changes in PCE inflation, we need a direct measure of commodity prices. Producer price indexes are the price measures that correspond most closely to the oil, gas, and crops commodity categories from the input-output tables. In examining these indexes, it is worth considering the prices of oil and natural gas separately because of differences in their dynamics in recent years.
Producer prices for oil and gas are shown in Figure 1. Although natural gas and crude petroleum prices both rose similarly from 1999 to 2008, they do not always move in tandem. For example, the price of natural gas spiked because of supply disruptions following the 2005 hurricanes, but supply disruptions for oil were more limited. Similarly, natural gas prices did not rise sharply in 2009 as oil prices did because the growth of shale gas extraction boosted supply.
Figure 2 shows the producer price indexes that we constructed for our two commodity categories. Compare the combined oil and gas index in Figure 2 with natural gas prices in Figure 1. From 1998 to 2008, movements in natural gas prices were important sources of movements for the oil and gas aggregate index. The 2008 spikes in petroleum and natural gas prices in Figure 1 show up as a record-high value of the oil and gas index in Figure 2.
Following this episode, oil and natural gas prices fell precipitously. Then, since its low in the second half of 2008, our constructed energy price index rose 57%, due largely to the run-up in oil prices. After these up-and-down price movements since January 2007, our index is up only a net of 9%.
Crop prices have risen much more over the same period. At the end of 2011, they were 50% higher than at the beginning of 2007. They also show very high volatility. After declining from their all-time high in the second half of 2008, they reached a new record in February 2011. Since then, they have retreated 16%.
Importance of commodities for PCE inflation since 2007
By combining the input-output information about commodity cost shares with our price indexes, we can calculate the contribution of energy- and food-related commodities to cumulative inflation in the headline PCE price index since January 2007. We construct this contribution by multiplying the cost share of each commodity, as shown in Table 1, by the cumulative producer price increase for each commodity since January 2007. This calculation method assumes that all commodity price changes pass through to PCE inflation immediately and fully.
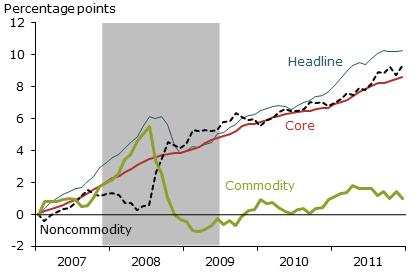
Figure 3
Commodity contributions to headline inflation

Sources: Bureau of Economic Analysis and authors calculations. 30,
Note: Percentage point cumulative contribution since January 2007.
Figure 3 depicts the results of our calculations. It shows that, if the 2008 commodity price spike had been fully passed through to inflation, by the summer of 2008 consumer prices would have climbed 5.5% above their January 2007 level. Commodity prices then began to fall. By the spring of 2009, commodities had actually subtracted from cumulative inflation since the start of 2007. As prices started rising again, the commodity contribution to PCE inflation returned to positive territory.
Figure 3 also shows the noncommodity contribution to PCE inflation. This is the difference between cumulative headline inflation and our calculation of the commodity contribution. The noncommodity contribution declined in the spring of 2008, indicating that surging commodity prices did not fully pass through to consumer prices. Overall, our breakdown of inflation shows only a small commodity contribution to cumulative PCE inflation. Of the 10% cumulative rise in PCE inflation between January 2007 and December 2011, about 1 percentage point was due to rising commodity prices.
To assess the contribution of energy- and food-related commodities to overall inflation, our analysis uses input-output, producer price, consumer spending, and PCE inflation data. This is the most accurate way of accounting for commodity inputs, but is very complicated. One shortcut is to consider core inflation, which is overall inflation excluding food and energy prices. Table 1 shows that commodities have their main effect on food and energy prices. Therefore, core inflation should go a long way in accounting for the effect of commodity prices on inflation. The red line in Figure 3 showing the core contribution to cumulative inflation demonstrates that core inflation is indeed a good proxy for our noncommodity measure. The noncommodity and core trajectories are remarkably similar. The only period they differed substantially was during the commodity price spike in 2008, when rising crop and energy commodity prices were not fully passed through to overall consumer prices.
Conclusion
Over the past five years, two commodity price spikes have occurred. This raises concerns that such commodity price increases could substantially push up overall inflation. We estimate that crops, oil, and natural gas make up about 5% of the cost of consumer goods and services, mostly through their direct consumption as food and fuels. When commodity price movements are taken into account, we find that their contribution to overall inflation is limited. PCE prices rose 10% from the beginning of 2007 to the end of 2011. Of that cumulative rise, about one percentage point was due to increasing oil, natural gas, and crop prices. Moreover, when the contribution of commodities to headline PCE inflation is netted out, the resulting cumulative inflation is remarkably similar to core inflation.
References
Bureau of Labor Statistics. 2010. “Inter-industry Relationships (Input/Output matrix).”
Hale, Galina, and Bart Hobijn. “The U.S. Content of ‘Made in China.’ ” FRBSF Economic Letter, 2011-25 (August 8).
Hobijn, Bart. 2008. “Commodity Price Movements and PCE Inflation.” FRB New York Current Issues in Economics and Finance 14-8 (November).
Opinions expressed in FRBSF Economic Letter do not necessarily reflect the views of the management of the Federal Reserve Bank of San Francisco or of the Board of Governors of the Federal Reserve System. This publication is edited by Anita Todd and Karen Barnes. Permission to reprint portions of articles or whole articles must be obtained in writing. Please send editorial comments and requests for reprint permission to research.library@sf.frb.org