Newspaper articles and editorials about the economy do more than just report on official data releases. They also often convey how the journalist and those interviewed feel about the economy. Researchers have recently developed ways to extract data on sentiment from news articles using text analysis and machine learning techniques. These measures of news sentiment track current economic conditions quite well. In fact, they often do a better job than standard consumer sentiment surveys at forecasting future economic conditions.
How people understand the economy can be shaped by both official data reports and individual opinions based on personal experiences or beliefs. Similarly, economic forecasters rely on models that incorporate both “hard” and “soft” information. Hard information includes objective and directly quantifiable measures such as output and employment, while soft information includes more subjective measures such as surveys of households or businesses asking about attitudes and expectations. Among the many soft measures available, the most popular are survey-based indexes of consumer sentiment by the University of Michigan and the Conference Board. Using these measures has been shown to improve the accuracy of economic forecasts (Souleles 2004, Carroll, Fuhrer, and Wilcox 1994, Bram and Ludvigson 1998).
Now more than ever, information about the public’s perceptions of the labor market, prices, interest rates, and other economic conditions is readily available in digital format online. At the same time, recent advances in computational techniques for quickly analyzing big data—particularly large volumes of text—have made it possible to measure and summarize public perceptions of economic conditions in a way that could be useful to policymakers and analysts trying to track and forecast the economy. For instance, researchers have used such techniques recently to measure economic policy uncertainty (Baker, Bloom, and Davis 2016) and relate it to economic activity (Leduc and Liu 2013).
This Letter discusses the methodology and findings of our research, Shapiro, Sudhof, and Wilson (2017), in which we use these new techniques to construct indexes measuring the economic sentiment embodied in newspaper articles. Our indexes differ from survey-based measures of consumer and business sentiment in two main regards. First, economic news articles generally focus on distinct events happening in the economy; by contrast, surveys of consumers’ and business leaders’ attitudes and expectations may be shaped in part by what they read in the news but also by many other experiences and sources. Second, our indexes are based on a very different methodology. Specifically, rather than asking survey respondents to report their views, we rely on computational text analysis to extract sentiment from economic and financial newspaper articles.
We use these techniques to construct monthly indexes measuring the degree of various types of sentiment reflected in a wide set of economic and financial news articles from January 1980 to April 2015. We find that the news sentiment indexes correlate strongly with contemporaneous key economic variables. Furthermore, news sentiment has significant power to predict these variables up to 12 months ahead. For most of these variables, our indexes have greater predictive power than the University of Michigan and Conference Board surveys when added to a standard forecasting model. For some of the economic outcomes, news sentiment measures can also enhance predictive power significantly, even after incorporating standard survey-based measures.
Sentiment text analysis
Sentiment analysis uses tools from the field of computational linguistics to quantify the emotional content in a set of text. There are two general approaches. The first, the lexical approach, relies on a pre-defined list of words associated with an emotion. The second approach uses natural language processing (NLP) tools, which rely on machine learning techniques. NLP analysis extracts emotional content from text based on both word choice and groups of words or “utterances.” The model is “trained” on a large body of text that contains a mapping between word groups and emotions. For instance, the Kanjoya model used in Shapiro et al. (2017) is trained using data from a social network website, where millions of users provide both their current emotion and text describing their feelings. The trained model can then be applied to utterances from other text to estimate the probability that each utterance expresses a particular emotion. The estimates from either approach can then be aggregated to form indexes.
A potential advantage of a model-based approach is that it does not rely on a researcher’s own subjective association between a word and a specific emotion. However, this approach is only as accurate as the training set. If the text in the training set is not representative of the text to which the model is applied, then the model’s predictions could be inaccurate. For example, terms like “inflation” and “recession” may have different connotations in a training set based on social media posts than they do in economic news articles. Under either the lexical or model-based approach, it is important for researchers to cross-validate the resulting sentiment estimates. Shapiro et al. (2017) construct indexes of sentiment using both the model-based approach and the lexical approach. These two types of indexes tend to pick up major economic events and correlate in the expected direction with indicators of current economic conditions, thus mitigating measurement concerns.
Constructing a news sentiment index
For their study, Shapiro et al. pulled an archive of newspaper articles from 16 major U.S. newspapers between 1980 and 2015 from LexisNexis. They selected articles with at least 200 words where LexisNexis identified the article’s topic as “economics” and the country subject as “United States.” They also required the article to contain “said,” “says,” “told,” “stated,” “wrote,” or “reported” in order to focus on articles most likely to have some emotional content. In total, they used approximately 231,000 articles.
Each article was processed through Kanjoya’s model to create a model-based sentiment score. Specifically, the model computes the likelihood that the article expresses a particular sentiment based on the words and word groupings in the article. Similarly, Kanjoya generates a lexical score, which is the share of words in the article the model classifies as being associated with a certain sentiment. Kanjoya provides a predictive model for a large set of emotions, but we focus here on the indexes constructed from the model for “negativity.”
Shapiro et al. then aggregated the article-specific sentiment scores into a monthly index, relying on a statistical adjustment that accounts for changes over time in the composition of the sample across newspapers and across article types (editorials vs. regular articles). They focused their analysis on Kanjoya’s model-based measure of “negativity,” though they also compared its results to those based on model-based measures of “worried” and “satisfied,” and a lexical measure of negativity.
News sentiment indexes
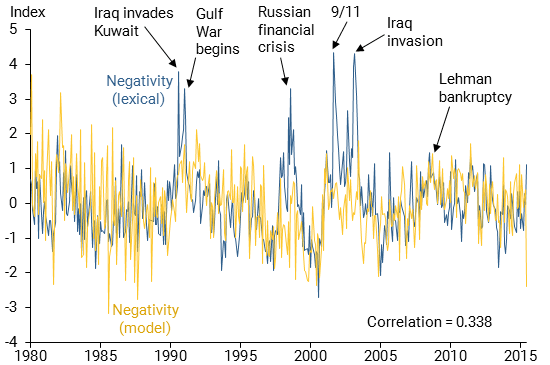
Figure 1 plots the two news sentiment indexes for negativity over time, the negativity-lexical series (blue line), and the negativity-model series (yellow line). First, notice the two series are strongly correlated. Second, both tend to spike during months of key historical events affecting economic outcomes and financial markets, such as the start of the first Gulf War (August 1990); the Russian financial crisis (August 1998); the September 11, 2001, terrorist attacks; and the Lehman Brothers bankruptcy (September 2008).
Figure 1
Negativity model-based and lexical measures over time
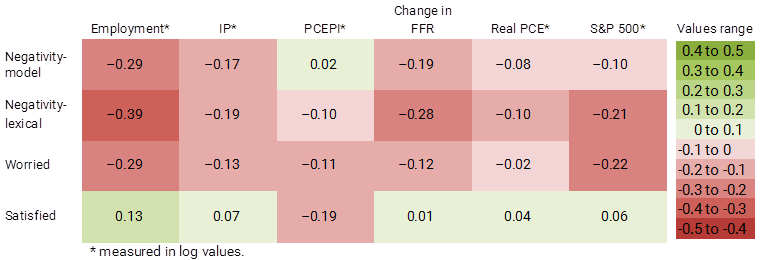
Shapiro et al. next assessed how these four measures of news sentiment correlate contemporaneously with key economic outcomes. The outcomes they considered were monthly changes in the federal funds rate (FFR), the S&P 500 stock price index, real personal consumption expenditures (PCE), total nonfarm employment, industrial production (IP), and the PCE price index (PCEPI); the latter five variables are measured in log values.
Figure 2 shows correlations between the indexes and economic indicators, color-coded according to a numerical range. Green indicates positive relationships, meaning both values move in the same direction, and red indicates negative relationships, signaling that when one value increases, the other decreases. The negativity-model, negativity-lexical, and worried indexes are each negatively correlated with all five of the “real-side” economic outcomes, that is, everything except for PCEPI inflation. The satisfied index is positively correlated with all five real-side outcomes. The pattern of correlations for PCEPI inflation is less clear: Satisfied is negatively correlated with inflation, as is negativity-lexical and worried, while negativity-model has a very small positive correlation.
Figure 2
Correlation of news sentiment indexes to select economic indicators
Does news sentiment predict economic activity?
To assess whether news sentiment affects economic activity, Shapiro et al. examined how both employment and the PCEPI respond to a surprise or “shock” to the model-based negativity index. Intuitively, the cause of the shock can be interpreted as a news report that was unrelated to current economic activity and the recent trend in news sentiment. The shock is constructed as the component of the negativity sentiment index that is independent of past values of the index itself and of past and current values of the six economic indicators listed above.
Figure 3 depicts how inflation and employment respond to a one-standard-deviation news sentiment shock along with 90% statistical confidence bands. In the months after the shock, employment and the PCEPI decline, although the employment effect does not quite achieve this conventional, somewhat loose threshold for statistical confidence. The effects take some time to unfold. For example, a statistically significant effect on the PCEPI does not emerge until around three months after the shock.
Figure 3
Estimated responses of indicators to model-based negativity index shock
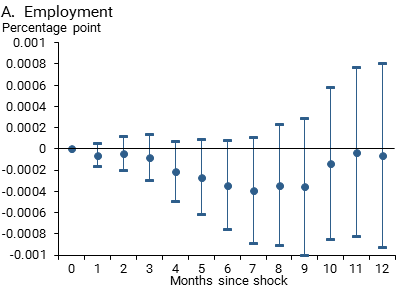
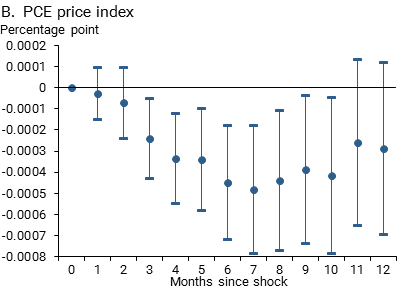
Note: Response by month following a one-standard-deviation news sentiment shock; bands show 90% statistical confidence.
Forecasting economic conditions, especially beyond a simple extrapolation of recent trends, is notoriously difficult. Nevertheless, policymakers and analysts always look for ways to improve their forecasts. Thus, as a final exercise, Shapiro et al. test whether the news sentiment indexes can improve projections from a standard forecasting model. Specifically, they compare forecasts of economic activity that use news sentiment with forecasts that use survey measures of consumer sentiment. Both sets of forecasts also incorporate lagged values of the six economic variables. The survey measures considered are the University of Michigan Consumer Sentiment Index and the Conference Board’s Consumer Confidence Index. In most cases, the news sentiment indexes have more predictive power than the consumer sentiment measures in head-to-head comparisons.
Taking a further step, Shapiro et al. considered models that included both the news sentiment index and traditional consumer sentiment surveys to assess whether news sentiment has predictive power over and above that provided by consumer sentiment alone. They found that using the news sentiment indexes enhanced a model’s forecasting power in many cases. In other words, for forecasting purposes, the news sentiment indexes provide information that can complement existing consumer sentiment indexes.
Conclusion
In this Letter, we describe recent research measuring news sentiment using computational text analysis of economic and financial newspaper articles. From these measures, we evaluate how well news sentiment tracks and predicts economic conditions. The results corroborate previous studies showing that sentiment has predictive power for future economic activity. Specifically, sentiment extracted from newspaper articles correlates with both contemporaneous and future key business cycle indicators. These methods of sentiment text analysis hold great promise for improving our understanding of news sentiment shocks and how they affect the economy.
Adam Hale Shapiro is a research advisor in the Economic Research Department of the Federal Reserve Bank of San Francisco.
Daniel J. Wilson is a research advisor in the Economic Research Department of the Federal Reserve Bank of San Francisco.
Data from the news sentiment indexes (Excel document, 44.6 kb)
References
Baker, Scott R., Nicholas Bloom, and Steven J. Davis. 2016. “Measuring Economic Policy Uncertainty.” Quarterly Journal of Economics 2016, 131 (4), pp. 1,593–1,636.
Bram, Jason, and Sydney C. Ludvigson. 1998. “Does Consumer Sentiment Forecast Household Expenditure? A Sentiment Index Horse Race.” Economic Policy Review 4(2).
Carroll, Christopher D., Jeffrey Fuhrer and David W. Wilcox. 1994. “Does Consumer Sentiment Forecast Household Spending? If So, Why?” American Economic Review 84(5), pp. 1,397–1,408.
Leduc, Sylvain, and Zheng Liu. 2013. “Uncertainty and the Slow Labor Market Recovery.” FRBSF Economic Letter 2013-21 (July 22).
Shapiro, Adam Hale, Moritz Sudhof, and Daniel Wilson. 2017. “Measuring News Sentiment.” FRB San Francisco Working Paper 2017-01.
Souleles, Nicholas. 2004. “Expectations, Heterogeneous Forecast Errors, and Consumption: Micro Evidence from the Michigan Consumer Sentiment Surveys.” Journal of Money, Credit, and Banking 36(1), pp. 39–72.
Opinions expressed in FRBSF Economic Letter do not necessarily reflect the views of the management of the Federal Reserve Bank of San Francisco or of the Board of Governors of the Federal Reserve System. This publication is edited by Anita Todd and Karen Barnes. Permission to reprint portions of articles or whole articles must be obtained in writing. Please send editorial comments and requests for reprint permission to research.library@sf.frb.org