When lenders experience unexpected losses, the supply of credit to borrowers can be disrupted. Researchers and policymakers have long sought estimates of how the availability of loans changes following a shock. The sudden oil price decline in 2014 offers an opportunity to observe precisely how affected lenders altered their portfolios. Banks that were involved with oil and gas producers cut back on some types of lending—consistent with traditional views of bank behavior. However, they expanded other types of lending and asset holdings with a bias towards less risky securities.
The financial crisis that began in 2007 emphasized the importance of a healthy banking system. As banks faced losses on their investments, they pulled back from their vital role as intermediaries between savers and borrowers. Companies consequently found it more difficult to obtain loans and cut back on their operations further, contributing to the weakness of the broader economy (Chodorow-Reich 2014). Understanding how banks behave following losses is therefore critically important to economists and policymakers. Indeed, under the post-crisis stress testing program, envisaging how banks cope with damaging events has become a core component of the regulatory framework.
In this Economic Letter, we discuss our recent work (Bidder, Shapiro, and Krainer 2017) that investigates how banks responded to losses on their loans to oil and gas (O&G) extracting businesses following the dramatic decline in oil prices in 2014. We show that banks with high exposure to these companies subsequently shifted away from portfolio lending—loans kept on their balance sheet—and towards holdings of safe securities. Banks typically did not shrink the overall quantity of investments, as much of the existing banking literature would suggest (Peek and Rosengren 1997, Holmstrom and Tirole 1997, and Khwaja and Mian 2008, among others), but rather changed the composition. They reduced the risk on their balance sheets instead of shrinking them.
The oil shock of 2014
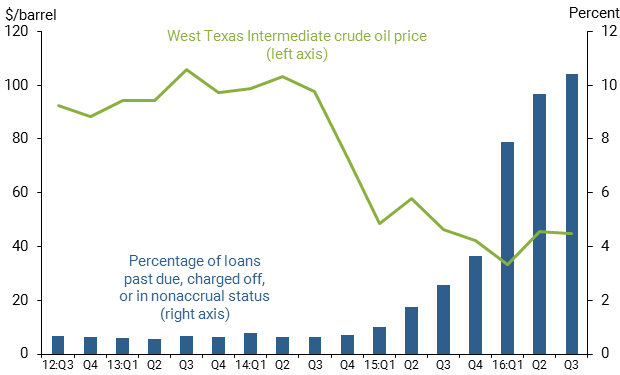
The price of oil declined dramatically and unexpectedly in the second half of 2014. As the red line in Figure 1 shows, oil had been fluctuating around $100 per barrel for some time, and market expectations based on oil futures were for prices to remain around that level through the end of the year and beyond. However, prices fell precipitously, breaking through the level many oil producers needed to maintain profitability. This caused O&G firms to delay or cease payment on loans, as illustrated by the blue bars in Figure 1. The fraction of loans that were either past due, charged off, or in nonaccrual status climbed from 0.6% in mid-2014 to 10.4% in 2016.
Figure 1
Oil prices and commercial loan performance
Before the oil price decline, banks held varying amounts of O&G loans. Some had made relatively few loans to O&G, while others had significant exposure. Those banks with a particularly large exposure to the O&G sector would be expected to face larger losses due to the oil price decline, all else being equal. For our study, we measure a bank’s exposure to the O&G sector by taking the fraction of total committed commercial lending, including off-balance-sheet items such as credit lines, accounted for by O&G. The average exposure among the banks in our study was approximately 6% with a standard deviation of around 5%. Another way to think about this is that an average bank’s total committed exposure was approximately 2.3% of its total assets and 20% of its capital—a large enough exposure to have an impact without implying a serious threat to its solvency.
Data
In addition to the public financial reports banks must file—known as FR Y-9 reports—we use data from regulatory filings required as part of the stress testing implemented after the financial crisis, known as the Comprehensive Capital Analysis and Review (CCAR). Domestic bank holding companies with greater than $50 billion in total assets—28 institutions total—are required to file these FR Y-14 reports, which provide very detailed data on their balance sheets, particularly their asset holdings.
The most relevant data in our study come from banks’ corporate lending and mortgage loans. The data are at the loan level, containing information on both the loan and borrower characteristics. While the data relate only to the CCAR institutions, they account for approximately 70% of total corporate lending by banks in the United States and extend to a much broader set of borrowers and loans than other available data sets.
How did bank lending change after the oil price shock?
We track how various balance sheet items behave around the time of the oil shock in Figure 2. We first group the balance sheet items depending on banks’ O&G exposure, controlling for earlier trends of each bank. We then plot the difference between high-exposure and low-exposure banks for commercial and industrial (C&I) lending, residential lending, and agency mortgage-backed securities (MBS). Relative to the less exposed banks, C&I loans and residential mortgages declined among the more exposed banks after the price shock. These patterns align with the traditional view of how banks respond to losses—they pull back on lending and in total assets more broadly.
Figure 2
Bank balance sheet adjustments by relative exposure to oil-related lending
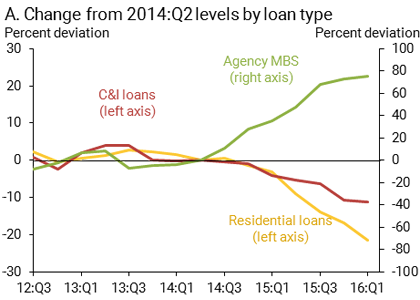
Note: Data are from U.S. bank holding companies with assets of at least $50 billion. Risk exposure is to oil and gas producer lending.
By contrast, the more exposed banks increased their holdings of MBS, qualitatively a mirror image of the patterns observed in C&I and residential lending. Thus, rather than a general pullback in asset holdings, some types of asset holdings increase. Agency MBS are pools of mortgages securitized by government-sponsored enterprises (GSEs), such as Fannie Mae and Freddie Mac, and Ginnie Mae. These mortgage pools are treated as very low-risk securities by regulators because of credit guarantees by the GSEs and, in the case of Ginnie Mae, an explicit government guarantee. In contrast, nongovernment residential mortgages that banks hold on their balance sheets typically carry no credit guarantee and, thus, have higher risk weights.
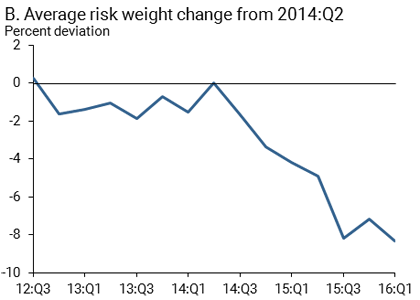
Regulators require banks to maintain certain minimum ratios of capital to risk-weighted assets; the latter is simply the sum of the value of assets held, with each asset weighted by its risk weight. All else being equal, by minimizing the risk weights on its balance sheet banks can conserve their regulatory capital. If a bank wishes to reduce its risk-weighted assets it can either reduce its total assets or substitute away from high risk-weighted assets and towards lower risk-weighted assets. The move from C&I and mortgage assets to agency MBS is an example of the second approach. In fact, the data show this through the path of the average risk weight—total risk-weighted assets divided by total assets. Panel B of Figure 2 shows that the average risk weight of the more exposed banks fell relative to the less exposed banks following the oil price decline. We find that this type of “de-risking,” rather than cutting back on asset holdings overall, characterizes how exposed banks responded to the oil price shock.
Inspecting the mechanism
Next, we use detailed data from the FR Y-14 reports and lending surveys to explore how banks reduced their risk. We begin by disentangling credit supply factors, which are determined by bank policy, from credit demand, which is shaped by borrowers’ needs. Some patterns showing lending declines might simply be a fluke if borrowers at those banks were disproportionately affected by the oil shock and decided to cut back their borrowing, regardless of banks’ policies. By analyzing firms that borrowed from both exposed and non-exposed banks, we show that the relative decline in corporate lending is indeed due to exposed banks tightening their credit supply rather than factors related to loan demand.
Declines in lending were particularly large among borrowers with multiple bank relationships, suggesting that such businesses switched lenders. Thus, while banks may have been tightening the quantity of credit they offered at a given price, they were also tightening by raising the cost of borrowing. Data from the Senior Loan Officers Opinion Survey in Figure 3 illustrate this result. Relatively more exposed banks raised interest rates and tightened standards for lending. Consequently, businesses substituted away from these worsening terms toward loans offered by other banks. Banks exposed to the oil price decline were thus able to reduce their corporate lending by increasing the price of their loan products, with the awareness that price changes would elicit a response from borrowers.
Figure 3
Bank survey responses regarding relative risk exposure to oil-related lending
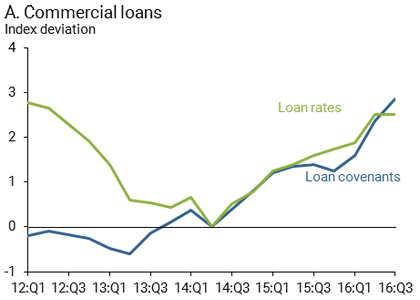
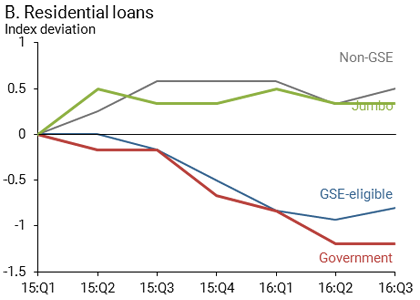
Note: Data from Senior Loan Officer Opinion Surveys. Risk exposure is to oil and gas producer lending.
Recalling the similarity between the corporate and mortgage lending from the FR Y-9 data in Figure 2, one might think the story is the same on the mortgage side—that is, banks simply tightened mortgage credit. However, we find that the reality is more complex. Panel B of Figure 3 shows that banks with more exposure to the O&G sector tightened terms on residential loans that could not be securitized into MBS (non-GSE and jumbo loans), but eased terms on loans that could be securitized (GSE-eligible and government loans). Thus, while banks did tighten credit on portfolio mortgages, lending survey data suggest they eased terms for mortgages that were considered safer.
Banks implemented portfolio rebalancing by changing the relative terms of lending on different types of products. They cut prices on loans they wanted more of and raised prices on those they wanted less of. This resulted in a reallocation among the banks’ assets rather than a uniform reduction. The additional lending via securitized mortgages explains at least part of the significant increase in agency MBS held by exposed banks: They shifted the higher risk-weighted mortgages off their balance sheets in exchange for the lower risk-weighted MBS to achieve their desired de-risking.
Conclusions
Our findings outlined in this Letter touch on many important theoretical and regulatory issues. We find evidence that financial shocks matter for a broad class of lending, even in so-called normal times, when financial markets are in good shape and banks’ solvency is not directly threatened. The standard view in the banking literature is that banks decrease lending after a damaging financial shock. Our study shows that this is only part of a more complicated balancing—or rebalancing—act. While we find that banks restrict portfolio lending, they also expand some other types of lending and simultaneously increase their holdings of less risky and more liquid securities. Thus, the impact of damage to banks varies across types of borrowers, rather than being shared equally by all. In a world where regulatory ratios are often defined with respect to risk-weighted assets, acknowledging these subtleties is vital.
Rhys Bidder is an economist in the Economic Research Department of the Federal Reserve Bank of San Francisco.
John Krainer is a research advisor in the Economic Research Department of the Federal Reserve Bank of San Francisco.
Adam Shapiro is a research advisor in the Economic Research Department of the Federal Reserve Bank of San Francisco.
References
Bidder, Rhys, John Krainer, and Adam Shapiro. 2017. “De-leveraging or De-risking? How Banks Cope with Loss.” FRB San Francisco Working Paper 2017-03.
Chodorow-Reich, Gabriel. 2014. “The Employment Effects of Credit Market Disruptions: Firm-Level Evidence from the 2008-09 Financial Crisis.” Quarterly Journal of Economics 129(1), pp. 1–59.
Holmstrom, Bengt, and Jean Tirole. 1997. “Financial Intermediation, Loanable Funds and the Real Sector.” Quarterly Journal of Economics 112(3), pp. 663–691.
Khwaja, Asim Ijaz, and Atif Mian. 2008. “Tracing the Impact of Bank Liquidity Shocks: Evidence from an Emerging Market.” American Economic Review 98(4), pp. 1,413–1,442.
Peek, Joe, and Eric S. Rosengren. 1997. “The International Transmission of Financial Shocks: The Case of Japan.” American Economic Review 4, pp. 495–505.
Opinions expressed in FRBSF Economic Letter do not necessarily reflect the views of the management of the Federal Reserve Bank of San Francisco or of the Board of Governors of the Federal Reserve System. This publication is edited by Anita Todd and Karen Barnes. Permission to reprint portions of articles or whole articles must be obtained in writing. Please send editorial comments and requests for reprint permission to research.library@sf.frb.org