A key measure of inflation finally reached the Fed’s 2% target in July after remaining persistently below that for years after the end of the last recession. Analysis shows that most of the increase in personal consumption expenditures price inflation towards the Fed’s target can be attributed to acyclical factors and are not due to a strengthening economy. While risks to the outlook for inflation appear broadly balanced, they include the considerable possibility that inflation has not yet sustainably reached target.
In his July testimony to Congress, Fed Chairman Jerome Powell said, “the 2% [inflation] objective is ‘symmetric’ because the FOMC would be concerned if inflation were running persistently above or below our objective.” This explains the concern when a standard inflation measure—the year-over-year change in the core personal consumption expenditures (PCE) price index—remained below 2% for years after the end of the latest recession. However, core PCE inflation finally reached 2% in July, potentially signaling the end of persistent low inflation and the beginning of a period when inflation will hover sustainably and symmetrically near the FOMC’s target.
In this Economic Letter, I assess the recent rise in inflation using the methods from Mahedy and Shapiro (2017), who divide the subcategories of inflation into two groups: cyclical and acyclical. Inflation within the acyclical group is more likely to be driven by idiosyncratic factors, while inflation in the cyclical group is more likely to be driven by overall economic conditions and hence is more sensitive to monetary policy.
The decomposition shows that the recent rise in inflation was mainly attributable to idiosyncratic factors. Despite a strengthening of the economy over the past year, cyclical inflation has remained fairly steady and is currently relatively lower than expected given the very tight labor market. By contrast, the portion of acyclical sectors that do not include health services (non-health acyclical inflation) is currently experiencing relatively high inflation. If non-health acyclical inflation were to revert to more normal historical levels, it would imply some downside risk that future inflation would fall below target again. Overall, the analysis shows the risks to the inflation outlook are balanced between a potential rise or fall. However, a considerable possibility remains that inflation has not yet sustainably reached target.
Cyclical and acyclical inflation
One way to measure the relationship between economic health and inflation is through the standard Phillips curve framework. This relationship posits that during times of economic prosperity there is increasing pressure on businesses to push prices up, causing inflation to rise. Conversely, during times of economic distress, businesses are less likely to raise prices and inflation is more likely to decline. Changes in prices that move with overall economic conditions can be referred to as cyclical movements in inflation. An extensive literature examines the cyclical nature of inflation by estimating the slope of the Phillips curve (Gali and Gertler 1999 and Shapiro 2008). A “flat” Phillips curve means that changes in overall economic conditions have little impact on inflation, while a “steep” curve means that small changes in economic conditions can have a large impact on inflation.
Businesses also change prices for reasons specific to their particular industry. For example, mainly due to a change in Verizon’s data plan in early 2017, cellular telephone service prices fell 13%, subtracting about 0.2 percentage point from core PCE inflation over the year. Another example is the Budget Control Act of 2011, which introduced a one-time 2% reduction to Medicare payments in April 2013, and was projected to subtract about 0.25 percentage point from core PCE inflation between 2013 and 2016 (Clemens, Gottlieb, and Shapiro 2014).
These types of changes in prices that do not necessarily move with overall economic conditions can be referred to as acyclical fluctuations in inflation.
Businesses’ pricing sensitivity to overall economic conditions and industry-specific factors varies across categories of goods and services. Mahedy and Shapiro (2017) divide the basket of goods used to measure core PCE inflation into those industries where prices tend to be more sensitive to overall economic conditions, termed “procyclical” or cyclical inflation, and those that are more sensitive to industry-specific factors, termed “acyclical” inflation. For each category in the core PCE basket, Mahedy and Shapiro estimate a Phillips curve model that relates changes in prices for that category to the unemployment gap—the gap between the national unemployment rate and its long-term or natural rate—from 1985 to 2007. If the relationship between the unemployment gap and the category’s inflation rate is negative and statistically significant, the category is considered cyclical. If the category does not satisfy that criterion it is considered acyclical. (See Cyclical and Acyclical Core PCE Inflation for details and updated data.)
The categories exhibiting a cyclical relationship make up 42% of the PCE and include housing, recreational services, food services, and some nondurable goods. The Phillips curve slope for these categories is 0.3, which is about twice as steep as the slope using all categories that make up core PCE inflation, but still could be construed as relatively flat. Specifically, a 1 percentage point decline in the unemployment gap implies only a 0.3 percentage point increase in cyclical inflation or a 0.13 percentage point increase in core PCE inflation. The acyclical categories that make up the remaining 58%, include health-care services, financial services, clothing, transportation, and some other smaller categories.
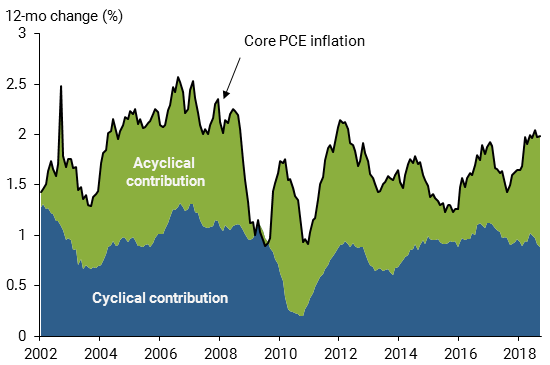
Figure 1 shows that each category has contributed about half of core PCE price inflation on average over the past 15 years. Cyclical inflation rose steadily coming out of the recession, as would be expected in a Phillips curve framework; however, the series has been flat more recently. That is, cyclical inflation has not risen with the continued strengthening in the economy over the past year. Instead, the recent increase in core PCE inflation can be attributed to the acyclical categories. In other words, acyclical inflation is now contributing about 0.5 percentage point more than it was a year ago.
Figure 1
Cyclical and acyclical contributions to core PCE inflation

There is no smoking gun reason for this rise in acyclical inflation. Rather, a multitude of acyclical sectors experienced boosts in inflation. A couple of categories had particularly larger effects than others: cellular telephone services, due to the roll-off of the Verizon price cut, and financial service charges and fees. This latter category, which includes charges for deposit accounts, credit card services, and automatic teller machines (ATMs), rose 10% over the past year. Combined, these two categories are responsible for about half of the increase in acyclical inflation over the past year.
Risks to the inflation outlook
The decomposition of core PCE inflation between cyclical and acyclical components sheds light on why inflation climbed to 2%. It also is useful in explaining where inflation may be headed: the decomposition highlights both upside and downside risks to the inflation outlook.
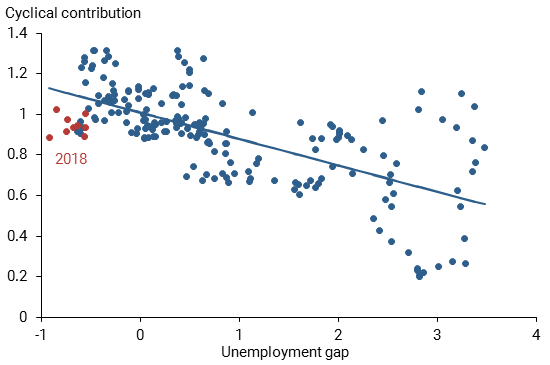
As shown in Figure 1, although cyclical inflation climbed immediately after the recession, it has remained relatively steady over the past few years even though the labor market has continued to tighten. Given the tight labor market, what can be considered a normal level of cyclical inflation? Figure 2 helps answer this question by depicting the relationship between cyclical inflation and the unemployment gap. The fitted trend line from the data shows the clear negative relationship between the two variables, owing to the classification of the underlying categories based on the Phillips curve model. Cyclical inflation is currently lower than would be expected given the current level of the unemployment gap. Specifically, the red points show the monthly values of year-over-year changes in the cyclical contribution to core PCE inflation between January and August of 2018. The fact that they lie below the fitted line implies some upside risk to the inflation outlook. Core PCE inflation would rise 0.1–0.2 percentage point if cyclical inflation were to climb back to its model-implied level—or it could rise even further if the labor market continued to tighten.
Figure 2
Cyclical contribution to core PCE versus unemployment gap

Source: Bureau of Economic Analysis, Congressional Budget Office, Bureau of Labor Statistics, and author’s calculations.
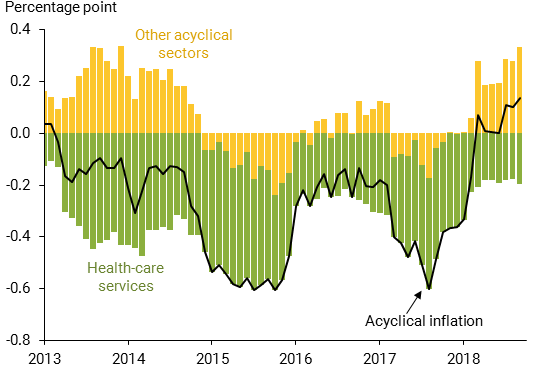
To gauge the outlook for acyclical inflation, it helps to further divide the series between health and non-health acyclical categories. As shown in Clemens, Gottlieb, and Shapiro (2014), health-care services price inflation is highly influenced by public payments and is therefore more persistent and predictable than the other acyclical categories. The black line in Figure 3 shows the difference between the acyclical contribution and its 2002–2007 average. This period serves as a good benchmark because during this time there were no recessions and inflation averaged 2%. The green and yellow bars show how health-care and the other acyclical sectors contributed to this difference. The rise in acyclical inflation stems mainly from the non-health acyclical sectors (yellow bars). These sectors added 0.2 percentage point more to core PCE inflation than they had during the benchmark period, indicating that inflation in these sectors is relatively high.
Figure 3
Difference between acyclical contribution and 2002-07 trend

Source: Bureau of Economic Analysis and author’s calculations
By contrast, health-care services inflation (green bars) is still relatively low, contributing about 0.2 percentage point less than it did in the benchmark period. Specifically, health-care service prices grew 1.9% over the past year, in contrast to 3% annual growth during the 2002–2007 period. More broadly, health-care services inflation has been trending down over the past few decades, averaging 4.2% during the 1990s, 3.2% during the 2000s, and 1.4% during the 2010s. As discussed in Clemens, Gottlieb, and Shapiro (2016), health-care services inflation is being dragged down by legislated cuts to public payment growth. Public payment growth rose somewhat over the past year, as some of the legislated cuts were removed. However, many of the legislated payment changes are permanent or in effect for several more years, implying that health-care services inflation is likely to remain below its benchmark level for some time.
Unlike health-care services inflation, non-health acyclical inflation is not very persistent, meaning that any movement away from its benchmark level is likely to dissipate rather quickly. In fact, a shock to non-health acyclical inflation persists for less than a year on average. This implies some likelihood that non-health acyclical inflation will fall back to benchmark levels, contributing less to overall inflation.
Conclusion
After remaining persistently below 2% for most of the post-recession period, core PCE inflation finally reached 2% in July 2018. This Letter shows that most of this increase towards target can be attributed to acyclical factors and was not due to a strengthening economy.
Risks to the inflation outlook appear broadly balanced. However, there is a considerable possibility that inflation will fall below the FOMC’s 2% target. While cyclical inflation is low compared with the level suggested by standard Phillips curve theories in relation to the very low unemployment rate, inflation rates in non-health acyclical categories are currently high compared with benchmark levels. This implies that the recent upward pressure stemming from acyclical factors could diminish in the future.
Adam Shapiro is a research advisor in the Economic Research Department of the Federal Reserve Bank of San Francisco.
References
Note: Calculations and underlying data used in this Letter are available online in a technical appendix.
Clemens, Jeff, Josh Gottlieb, and Adam Shapiro. 2016. “Medicare Payment Cuts Continue to Restrain Inflation.” FRBSF Economic Letter 2016-15 (May 9).
Clemens, Jeff, Josh Gottlieb, and Adam Shapiro. 2014. “How Much Do Medicare Cuts Reduce Inflation?” FRBSF Economic Letter 2014-28 (September 22).
Gali, Jordi, and Mark Gertler. 1999. “Inflation Dynamics: A Structural Econometric Analysis.” Journal of Monetary Economics 44(2), pp. 195–222.
Mahedy, Tim, and Adam Shapiro. 2017. “What’s Down with Inflation?” FRBSF Economic Letter 2017-35 (November 27).
Shapiro, Adam. 2008. “Estimating the New Keynesian Phillips Curve: A Vertical Production Chain Approach.” Journal of Money, Credit, and Banking 40(4), pp. 627–666.
Opinions expressed in FRBSF Economic Letter do not necessarily reflect the views of the management of the Federal Reserve Bank of San Francisco or of the Board of Governors of the Federal Reserve System. This publication is edited by Anita Todd and Karen Barnes. Permission to reprint portions of articles or whole articles must be obtained in writing. Please send editorial comments and requests for reprint permission to research.library@sf.frb.org