News about the COVID-19 public health crisis has affected asset prices to varying degrees across sectors of the U.S. economy. Stocks in the utilities, real estate, and energy sectors initially suffered the worst sector-specific shocks, while the information technology, health-care, and telecommunications sectors fared relatively better. Businesses with higher financial leverage saw larger declines in their valuations. A simultaneous repricing of credit derivatives suggests concerns about insolvency contributed to the valuation declines. Although some stocks are recovering from the initial lows, significant differences across sectors remain.
The U.S. financial market’s reaction to the coronavirus disease 2019 (COVID-19) pandemic has been swift and forceful, providing a real-time assessment by market participants of the economic repercussions from the public health crisis. In this way, stock prices reflect the market’s views of the effects of the crisis on corporate profits. Forward-looking stock prices can also shed light on the varied impact of the pandemic across different sectors of the economy. Based on the market reaction to COVID-19 news, this Economic Letter uses an event study to examine idiosyncratic shocks to corporate America and gain insights into how the crisis is expected to affect different parts of the economy. We also assess the market reaction to the announcement and passage of fiscal stimulus, as well as the overall impact as of mid-May.
Systematic risk, abnormal stock returns, and credit derivatives
In the United States, the Standard & Poor’s (S&P) 500 stock index reached an all-time high on February 19, 2020, despite news reports from China about the spread of the coronavirus since the beginning of the year. As the global spread of the coronavirus came to light, the stock market dropped precipitously, with the S&P 500 declining 38% between February 24 and March 20.
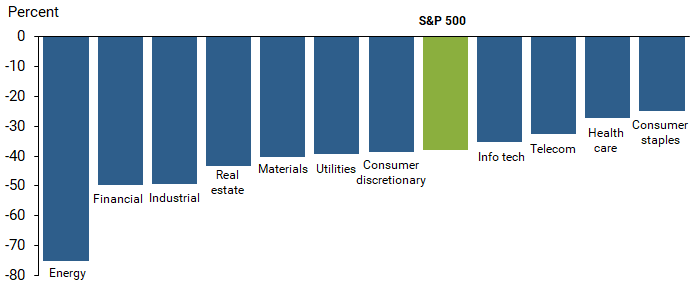
Figure 1 shows stock price movements by sector in the S&P 500. The energy sector registered the worst performance, falling 75%, while the sector with the least decline, consumer staples, dropped 25%. Between March 24 and March 27, the U.S. Congress proposed and passed the Coronavirus Aid, Relief, and Economic Security (CARES) Act, which was quickly signed into law, providing $2.2 trillion fiscal stimulus to aid the economy. The stock market retraced some of its losses and has since recovered about half of its fall from the peak.
Figure 1
S&P 500 returns by sector: February 24 to March 20
The initial decline in stock prices likely reflects both the change in expected future cash flows and the change in investors’ risk appetite. We view the change in a firm’s stock price as arising from two sources. One is the co-movement with the broader stock market. This systematic component captures both news about aggregate cash flow and changes in risk aversion. The other component is a business-specific idiosyncratic shock. Combining these idiosyncratic abnormal stock returns by sector provides a market-based measure of the impact of the pandemic on different sectors.
To examine whether the reduction in cash flow jeopardizes businesses’ ability to pay debt obligations and assess the potential spillover to the broader financial system, we investigate measures of credit risk from financial markets through spreads on credit default swaps (CDSs). A CDS is a financial contract that pays off in the event of a default. In addition to assessing the changes in default risk across sectors, we pay special attention to the largest systemically important banks for signs of systemic vulnerability that may threaten financial stability.
Stock market reaction to COVID-19 news
We study the abnormal stock returns for each firm in the S&P 500 over three event windows. The first begins on February 24, the start of a series of large stock market declines, and ends on March 20, the day before the $2.2 trillion fiscal stimulus gained traction. The second window, March 24–27, examines the stock market’s response to the introduction and passage of the CARES Act. The third window, February 24 to May 15, gauges the overall impact to date.
The abnormal return of a firm’s stock on a given day is the difference between its actual return and a reference return derived from the capital asset pricing model, encompassing the stock’s systematic co-movement with the market. When the event window is greater than one trading day, we cumulate the abnormal returns over the event window to yield the cumulative abnormal return, as in Ramelli and Wagner (2020).
To make statistical inferences, we divide the cumulative abnormal return by its standard deviation to yield the standardized cumulative abnormal return (SCAR), as in MacKinlay (1997). After accounting for the systematic risk or co-movement with the market, the SCAR isolates the firm-specific shock from the broader stock market shock.
Figure 2 shows the SCARs from February 24 to March 20 for each of the 11 sectors in the S&P 500, computed by value-weighting companies in each sector. While the energy sector had the worst unadjusted return, utilities had the biggest negative SCAR. This change in ranking reflects that the energy sector has more systematic risk, thus investors expect it to have a larger decline than the broader market. The utilities sector typically has less systematic risk, so the observed decline reflects a substantially negative SCAR.
Figure 2
SCARs by sector: February 24 to March 20
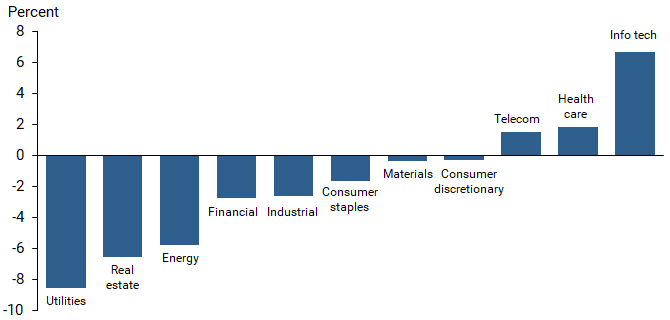
Although businesses in the travel and luxury goods industries were hit particularly hard by the pandemic, the SCARS for the industrial sector, which includes airlines, and the consumer discretionary sector, which includes hotels and luxury goods, outperformed the utilities, real estate, and energy sectors. The information technology sector had a significantly positive SCAR despite its unadjusted return being only marginally above the S&P 500. The health-care and telecommunications sectors also fared well in relative terms.
These abnormal returns reveal investors’ views of the different impact of the pandemic on corporate profits across sectors. At the broad level, this differentiation is in line with anecdotal evidence about the effects on cash flows in the health-care, information technology, and telecom sectors.
The CARES Act and thereafter
The same methodology allows us to assess the market reaction to the announcement and passage of the CARES Act, based on the event window of March 24–27. During this period, seven sectors outperformed the S&P 500’s 12.5% increase, by an additional 0.2% for health care up to an additional 9.1% for utilities. Although the telecom, consumer staples, consumer discretionary, and information technology sectors trailed the S&P 500 index, they nonetheless exhibited positive cumulative unadjusted returns over this four-day window.
After controlling for systematic risk, the SCARs in the telecom, information technology, and consumer discretionary sectors were negative in response to the CARES Act. These significantly negative abnormal returns suggest market participants viewed the CARES Act as assisting firms in those three sectors notably less than the average firm in the S&P 500. These trends could also reflect portfolio rebalancing away from these sectors in favor of the previously hardest hit sectors around the passage of the CARES Act. On the other hand, financial, industrial, real estate, and utilities sectors exhibited significantly positive abnormal returns. Their positive SCARs suggest market participants viewed the CARES Act as good news for firms in those four sectors. It appears that these firms might benefit specifically from the CARES Act, above and beyond the effects on the broader economy. Materials, consumer staples, energy, and health-care sectors exhibited insignificant abnormal returns, indicating that market participants viewed the effects of the CARES Act on these sectors as broadly in line with the overall market.
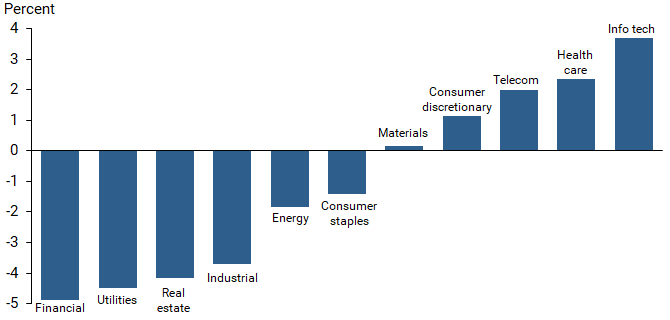
After the CARES Act, the stock market advanced further amid less devastating news about the virus, policy responses, and plans about reopening the economy. Figure 3 shows the SCARs from February 24 through May 15 to depict the overall impact so far. The pattern is broadly similar to the initial response but with a smaller magnitude. Significant differences across sectors remain evident.
Figure 3
SCARs by sector: February 24 to May 15
Signals from credit derivatives
To the extent that the pandemic could jeopardize a firm’s cash flow and hence its ability to pay its debts, the idiosyncratic shock would be related to a firm’s leverage. Indeed, the SCARs tended to be negatively related to book-value leverage during the first event window: firms with higher leverage experienced a significantly worse idiosyncratic shock. To delve deeper into concerns about the creditworthiness of corporate sectors, we investigate changes in their CDS spreads over the event windows. CDS spreads reflect a market assessment of the probability of default for a company.
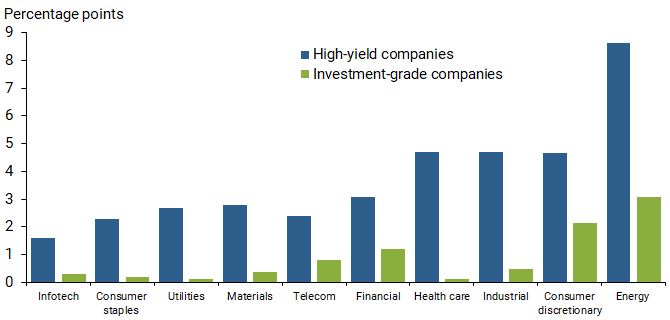
Figure 4 reports changes in average five-year CDS spreads by sector and credit rating over the first event window from February 24 to March 20. The spreads in all sectors widened, driven primarily by firms with credit ratings below investment grade. Among investment grade firms, those in the energy sector had the biggest widening in CDS spreads as well as large negative SCARs. The below-investment-grade energy firms’ CDS spreads widened by 8.6 percentage points, reflecting a significantly higher probability of default. Thus, rising default risk in energy firms clearly contributed to their sharp decline in equity values. CDS spreads in the consumer discretionary sector widened by 2.1 percentage points for investment-grade firms and 4.7 percentage points for high-yield firms. CDS spreads for below-investment-grade firms in health-care and industrial sectors rose almost 5.0 percentage points. For reference, a spread of this size roughly corresponds to a 32 percentage point default probability over the following five-year period, assuming a recovery rate of 35% for outstanding debt. The passage of the CARES Act partially reversed some of the widening of CDS spreads, particularly for energy and health-care firms.
Figure 4
Changes in credit default swap spreads: February 24 to March 20
However, CDS data do not point to abnormally high default risk for financial firms, which are exposed to heightened default risk by their borrowers. Thus, the probability of the COVID-19 crisis leading to failures of big financial firms, which were resilient and well capitalized at the onset of the pandemic, seems muted. For the financial sector, although the CDS spreads of each of the four largest banks—Bank of America, Citigroup, JP Morgan Chase, and Wells Fargo—widened to about 1.0 percentage point, they remained well below the levels during the global financial crisis of 2008–2009 and the European sovereign debt crisis of 2011–2012.
Conclusion
While the prices in the forward-looking equity market reflected a significant decline in corporate profits from depressed economic activities due to the COVID-19 pandemic, evidence shows that market participants have differentiated the economic impact across business sectors. Abstracting from the systematic shock to the market, the idiosyncratic shock hit the utilities, energy, and real estate sectors particularly hard, but did not spare the consumer discretionary sector that includes hotels and luxury goods, nor the industrial sector that includes airlines. The idiosyncratic shock, however, has been positive for telecommunications, health-care, and information technology firms. These firm-specific shocks are significantly negatively related to firm leverage. CDS data point to increased default risk for many businesses, especially those in the energy sector. While the CARES Act alleviated both the idiosyncratic shock and the default risk somewhat, significant differences across sectors remain. Nonetheless, the market sees relatively low risk so far of default for large financial firms and systemically important banks from the economic repercussions of COVID-19.
Simon H. Kwan is a senior research advisor in the Economic Research Department of the Federal Reserve Bank of San Francisco.
Thomas M. Mertens is a vice president in the Economic Research Department of the Federal Reserve Bank of San Francisco.
References
MacKinlay, A. Craig. 1997. “Event Studies in Economics and Finance.” Journal of Economic Literature 35 (1), pp. 13–39.
Ramelli, Stefano, and Alexander F. Wagner. 2020. “Feverish Stock Price Reactions to COVID-19.” Working paper, Centre for Economic Policy Research.
Opinions expressed in FRBSF Economic Letter do not necessarily reflect the views of the management of the Federal Reserve Bank of San Francisco or of the Board of Governors of the Federal Reserve System. This publication is edited by Anita Todd and Karen Barnes. Permission to reprint portions of articles or whole articles must be obtained in writing. Please send editorial comments and requests for reprint permission to research.library@sf.frb.org