The COVID-19 pandemic has upended the U.S. labor market, with massive job losses and a spike in unemployment to its highest level since the Great Depression. How long unemployment will remain at crisis levels is highly uncertain and will depend on the speed and success of coronavirus containment measures. Historical patterns of monthly flows in and out of unemployment, adjusted for unique aspects of the coronavirus economy, can help in assessing potential paths of unemployment. Unless hiring rises to unprecedented levels, unemployment could remain severely elevated well into next year.
The wave of initial job losses during the coronavirus disease 2019 (COVID-19) pandemic has been massive, with more than 20 million jobs swept away between March and April. This is much larger than losses recorded during similar time frames in any other postwar recession. As a result, the April unemployment rate spiked to the highest level recorded since the Great Depression of the 1930s.
In this Economic Letter, we assess possible paths for unemployment through 2021. Although the initial scale of the crisis is clear, substantial uncertainty surrounds the future path of unemployment. This uncertainty primarily revolves around the success of virus containment measures and how quickly economic activity can recover. Fundamental measurement challenges are also likely to affect the official unemployment rate: some laid-off workers cannot actively search for new jobs because of shelter-in-place restrictions and hence may be counted as out of the labor force, rather than unemployed.
To assess the possible path of the measured unemployment rate through next year, we focus on the underlying monthly flows in and out of unemployment, accounting for historical patterns and unique aspects of the coronavirus economy; our approach and results are described in detail in Petrosky-Nadeau and Valletta (2020). Our analysis suggests that returning to pre-outbreak unemployment levels by sometime in 2021 would require a significantly more rapid pace of hiring than during any past economic recovery.
Initial wave of job losses and unemployment
Even before the Bureau of Labor Statistics (BLS) released April employment and unemployment numbers on May 8, the unprecedented scale of job losses due to coronavirus containment measures was clear. About 25 million new unemployment insurance (UI) claims were filed between mid-March, when U.S. containment measures started to spread widely and the BLS monthly survey was conducted, and mid-April when the next month’s BLS survey was conducted. During periods of intensive job loss, weekly reports on new UI claims provide a good measure of job losses because most laid-off workers are eligible for UI benefits. However, the current massive scale of new claims has swamped state UI agencies and likely delayed processing of many claims. As such, the recent surge should be interpreted as a loose lower-bound estimate of initial job losses.
A comparison with the Great Recession of 2007-09 starkly illustrates the severity of the current situation (Figure 1). Initial UI claims during the first month of the COVID-19 crisis were about 10 times larger than claims during the worst periods of the Great Recession.
Figure 1
Monthly initial unemployment insurance claims
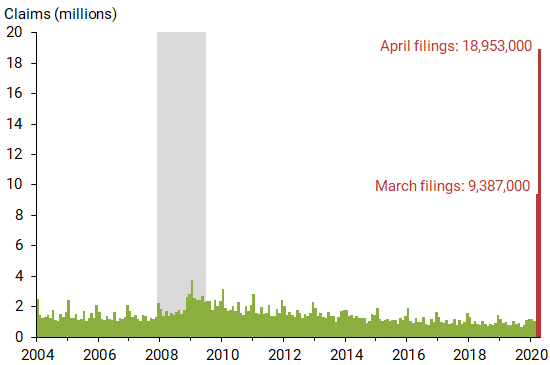
Note: Data from the U.S. Department of Labor, not seasonally adjusted (last
two data points rounded to nearest thousand; April data through May 2). Gray
bar indicates NBER recession dates.
These initial job losses, combined with a likely pronounced reduction in hiring activity, imply a sharp increase in the unemployment rate. Before the April BLS report was released, we projected that the unemployment rate was likely to rise nearly 15 percentage points, from 4.4% in March to 19.0% in April.
Other recent projections of the April unemployment rate span a very wide range (Faria-e-Castro 2020,
Wolfers 2020, Coibion, Gorodnichenko, and Weber 2020, and Bick and Blandin 2020). The wide range
partly reflects the challenge of measuring unemployment when shelter-in-place restrictions prevent active
job search in much of the country. This is evident in the estimates by Coibion et al. (2020) and Bick and
Blandin (2020), which differed substantially despite their reliance on careful surveys designed to
approximate the official BLS approach.
The official April employment report released on May 8 showed that unemployment rose to 14.7%, a huge increase but below our projection. However, the report also noted a large increase in the number of workers on unpaid absences, likely reflecting virus-related business closures. Counting these workers as unemployed would push the unemployment rate much closer to our 19% projection. We therefore have not modified our prior projections.
Unemployment projections based on labor market flows
Our approach to projecting the unemployment rate relies on the monthly flows between unemployment, employment, and out of the labor force (nonparticipation), similar to Şahin and Patterson (2012). In particular, the monthly change in the unemployment rate reflects the difference between the number who enter unemployment (inflows) and the number who exit unemployment (outflows), with employment and nonparticipation as possible initial or subsequent status. This framework accounts for the key determinants of pandemic-related unemployment, with initial UI claims (inflows through job loss) and depressed hiring (outflows) determining the initial spike in unemployment. Using this approach, we explore different scenarios for unemployment through the end of 2021. For all scenarios, we assume that job losses are most severe in April (about 25 million), then ease substantially in May (7.8 million) and June (2.6 million), before returning to their historical trend in July (1.4 million).
The path of the unemployment rate afterward depends on unemployment outflows, primarily reflected in the pace of hiring among the pool of unemployed individuals. Tremendous uncertainty surrounds the timing and strength of the hiring surge as the economy recovers. If the virus is contained quickly and the economic recovery is vigorous, hiring could rapidly resume, particularly if many businesses and workers have maintained their connections. However, hiring could be slow if virus outbreaks or continued containment measures make employers hesitant based on low demand for their products. We therefore explore a range of hiring scenarios over the coming months.
The first scenario, “historical outflow dynamics,” assumes that the pace of hiring corresponds statistically to the typical recovery from past recessions. Because hiring tends to bounce back slowly following recessions, and given the severity of the current downturn, this scenario is relatively adverse.
Our second scenario, “hiring bounce,” incorporates very strong hiring activity following an assumed end of COVID-19 restrictions in July 2020. This scenario provides a baseline for assessing the pace of hiring required to reverse the initial labor market shock. It assumes a return to pre-outbreak hiring rates by the end of the third quarter of 2020. However, the pace of hiring implied by this scenario is extremely high by historical standards given the vast pool of unemployed individuals. In particular, this scenario requires around 9 million hires from unemployment per month during the third quarter, nearly four times faster than the most robust hiring rate during the recovery from the Great Recession.
Our third scenario, “GDP/hiring forecast,” bases hiring projections on the historical relationship between GDP growth and overall exit rates from unemployment to employment or nonparticipation. This requires a GDP forecast. We rely on a recent San Francisco Fed forecast of GDP growth for 2020-21, specifically the more favorable of two alternatives discussed in qualitative terms in Leduc (2020). It assumes that growth bounces back in the second half of this year and continues at a strong pace next year.
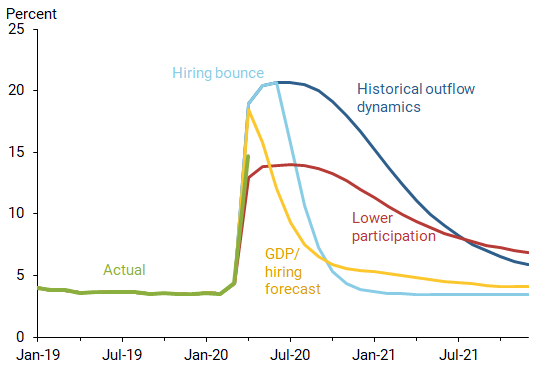
Figure 2 shows the unemployment paths for these scenarios. In the historical outflow dynamics scenario (dark blue line), unemployment quickly peaks around 20% and then stays in double digits through early 2021. By contrast, the hiring bounce scenario (light blue line) reflects a stronger recovery in hiring activity, so the unemployment rate drops much more rapidly. At the end of 2020 most of the job losses have been reversed, and unemployment approaches pre-outbreak levels. For the GDP/hiring forecast scenario (yellow line), unemployment peaks above 18% in the second quarter of 2020, followed by a rapid decline in the third quarter due to underlying limited changes in the hiring rate implied by its historical relationship with GDP growth.
Figure 2
Unemployment rate paths under different scenarios
Incorporating unemployment and nonparticipation ambiguities
As noted earlier, widespread shelter-in-place restrictions may preclude active job searches among laid-off workers, causing them to report themselves as out of the labor force rather than unemployed. Consistent with this, the official labor force participation rate fell 2.5 percentage points to 60.2% in April. We explore the potential impact of these measurement challenges through alternative assumptions about flow rates between different labor market states.
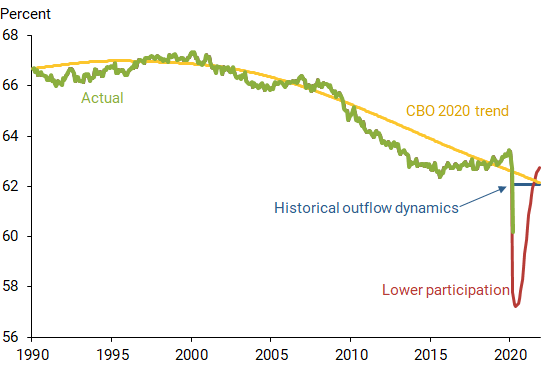
In particular, historical patterns of worker flows from employment to nonparticipation then back into employment during recoveries suggest that nearly half of those workers laid off during the pandemic could leave the labor force upon suffering a job loss. This moderates the initial rise in unemployment, shown as the lower participation scenario (red line) in Figure 2. As individuals return to the labor market during the recovery, lifting the labor force participation rate back toward its previous trend, the pace of return to a pre-outbreak unemployment rate is also muted. In fact, the historical outflow dynamics and lower participation scenarios converge at 8% unemployment in mid-2021. However, these two scenarios imply vastly different trajectories for the labor force participation rate. Figure 3 shows the paths for these scenarios over an extended time frame relative to the trend projected by the Congressional Budget Office (2020).
Figure 3
Labor force participation rate under different scenarios
Conclusions: An uncertain road to recovery
The COVID-19 pandemic has created tremendous labor market disruptions and profound hardship throughout the United States and the world. This is partly reflected in the sudden unprecedented increase in the U.S. unemployment rate in April, the first month for which the full effects of coronavirus containment measures are evident. To get a handle on the severity of the labor market disruption, we assess possible paths for unemployment through the end of 2021. Tremendous uncertainty surrounds unemployment projections over the next few years, so we do not claim that any specific scenario qualifies as “likely.” On the pessimistic side, absent a historically unprecedented burst of hiring, the unemployment rate could remain in double digits through 2021. From a more optimistic perspective, if shutdowns are lifted quickly and employers capitalize on the large pool of available workers by ramping up hiring, the unemployment rate could be back down near its pre-outbreak level by mid-2021.
Uncertainty about the path of the unemployment rate also reflects measurement challenges arising from the ambiguous labor force status of laid-off workers whose active job search is limited by shelter-in-place measures. This may temper the official unemployment rate, but at the expense of a lower labor force participation rate, which is an alternative indicator of labor market dislocation and hardship. Given the implied uncertainty about the measurement of future labor market conditions, it is imperative to closely monitor a wide range of indicators to assess how the U.S. labor market is evolving in response to the COVID-19 shock.
Nicolas Petrosky-Nadeau is a vice president in the Economic Research Department of the Federal Reserve Bank of San Francisco.
Robert G. Valletta is a senior vice president in the Economic Research Department of the Federal Reserve Bank of San Francisco.
References
Bick, Alexander, and Adam Blandin. 2020. “Real Time Labor Market Estimates during the 2020 Coronavirus Outbreak.” Manuscript, Arizona State University, April 15.
Coibion, Olivier, Yuriy Gorodnichenko, and Michael Weber. 2020. “Labor Markets During the COVID-19 Crisis: A Preliminary View.” BFI Working Paper, Becker Friedman Institute for Economics, University of Chicago, April 13.
Congressional Budget Office. 2020. “The Budget and Economic Outlook: 2020 to 2030.” Report 56020, January 28.
Faria-e-Castro, Miguel. 2020. “Back-of-the-Envelope Estimates of Next Quarter’s Unemployment Rate.” On the Economy, FRB St. Louis blog, March 24.
Leduc, Sylvain. 2020. “FedViews.” FRB San Francisco, April 6.
Petrosky-Nadeau, Nicolas, and Robert G. Valletta. 2020. “Unemployment Paths in a Pandemic Economy.” FRB San Francisco Working Paper 2020-18, May.
Şahin, Ayşegül, and Christina Patterson. 2012. “The Bathtub Model of Unemployment: The Importance of Labor Market Flow Dynamics.” Liberty Street Economics, FRB New York blog, March 28.
Wolfers, Justin. 2020. “The Unemployment Rate Is Probably Around 13%.” New York Times (The Upshot), April 16.
Opinions expressed in FRBSF Economic Letter do not necessarily reflect the views of the management of the Federal Reserve Bank of San Francisco or of the Board of Governors of the Federal Reserve System. This publication is edited by Anita Todd and Karen Barnes. Permission to reprint portions of articles or whole articles must be obtained in writing. Please send editorial comments and requests for reprint permission to research.library@sf.frb.org