Daniel Wilson, research advisor at the Federal Reserve Bank of San Francisco, provides his views on current economic developments and the outlook.
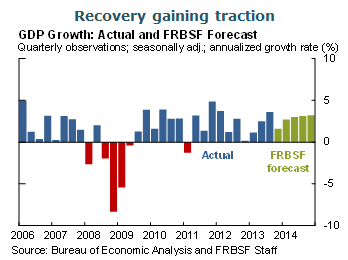
- Recent data suggest the recovery is gaining traction. Top-line GDP growth is likely to dip a bit in the fourth quarter, largely reflecting reduced accumulation of inventories by firms after a sizable increase in the third quarter. Importantly, indicators of consumer and business spending show signs of strength, and suggest solid economic growth in 2014.
- In addition to these indicators, our expectations for stronger growth in 2014 are based on ongoing housing market recovery, increases in stock market wealth, declines in energy prices, and a rebound in state and local government spending. We also expect some restraints, particularly federal fiscal policy, to ease.
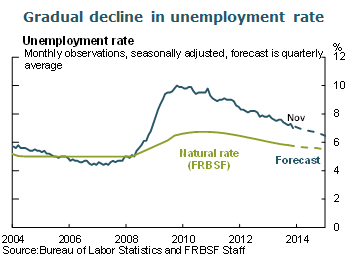
- Recent news on the labor market has been particularly encouraging, with employers adding just over 200,000 jobs in November, bringing the average monthly gain over the past three months to 193,000. In addition, the unemployment rate in November fell three-tenths of a percentage point to 7.0%. Though some of that decline reflected federal workers returning to work following the October government shutdown, it also reflected the labor market’s general ongoing recovery. Nevertheless, there remains a substantial amount of slack, as shown by the unemployment gap, which is the difference between the unemployment rate and our estimate of the natural or equilibrium rate of unemployment. We expect slack to improve gradually over the next couple of years.
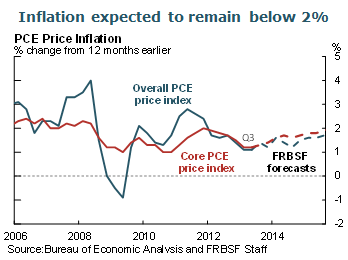
- Inflation over the past year has fallen further below the Federal Open Market Committee’s longer-run goal of 2%. This is due in part to lower inflation for energy and medical services, which we expect to be temporary, as well as ongoing economic slack. As the temporary factors dissipate and slack narrows, we expect inflation to gradually rise toward the 2% objective over the next two years.
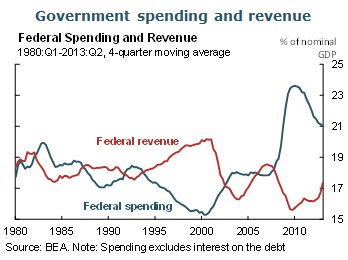
- As mentioned earlier, one factor behind the persistent economic slack and relatively modest growth during the current recovery is federal fiscal policy. Here we take a more in-depth look, assessing how contractionary recent policy has been compared with its typical pattern in recoveries and what we might expect over the next couple of years.
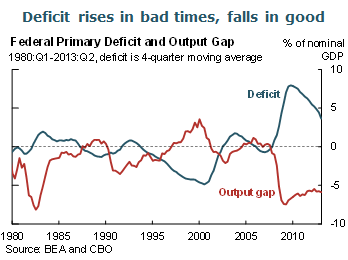
- We start with a broad overview of the typical historical pattern of federal government spending and revenue over the course of the business cycle. Generally speaking, federal spending is countercyclical, meaning it tends to rise in bad times and fall in good times. This pattern reflects two phenomena. First, spending on safety net programs automatically rises when economic conditions weaken, as more people become eligible for benefits. Second, Congress and the President frequently enact short-term stimulus spending measures during downturns to help boost the economy.
- Tax revenue, on the other hand, tends to be procyclical, falling in bad times and rising in good times. As with spending, there is both a passive, automatic element to this pattern and an active policy element. During downturns, as individual and corporate incomes fall, the tax base declines, as does tax revenue. As the economy picks back up and incomes rise again, tax revenue rises. On top of that, legislation, including temporary tax relief and tax incentives, often are enacted during recessions. Both of these factors contribute to the typical procyclical nature of federal revenue.
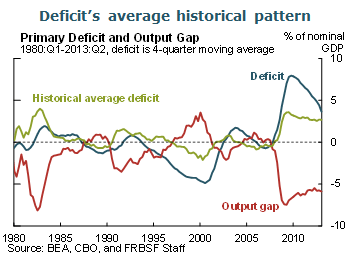
- In an economic downturn, increased federal spending and falling revenue combine, resulting in a larger budget deficit. Deficits are therefore countercyclical. By considering the historical relationship between economic conditions and the budget deficit, we can measure how much the deficit would normally rise during a downturn. Here, we measure economic conditions using the output gap as estimated by the Congressional Budget Office (CBO). The output gap is the percentage difference between actual and potential (or full-employment) GDP. However, our results would be similar if we used the unemployment gap. We relate the output gap to the primary deficit, which excludes net interest payments on debt. We find that between 1960 and the middle of 2013, a 1 percentage point drop in the output gap is associated with a 0.5 percentage point increase in the deficit-to-GDP ratio on average. For example, in the 1981–82 recession, the output gap fell by roughly 6 percentage points, while the deficit as a share of GDP rose by roughly 3 percentage points.
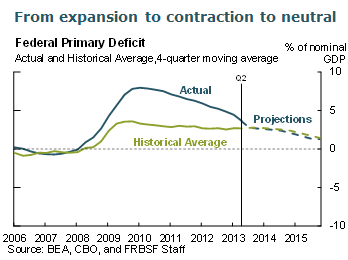
- Turning to the most recent recession and the recovery to date, we see that the deficit rose much more rapidly during the recession—from the fourth quarter of 2007 through the second quarter of 2009—than we would expect if fiscal policy were following the historical pattern. This atypical response was primarily due to the 2009 economic stimulus package, which included both substantial temporary increases in spending and tax reductions. After 2010, however, the stimulus spending began to fade and the deficit began to fall. As the recovery proceeded, new cuts in spending were implemented, temporary tax reductions expired, and the decline in the deficit accelerated. Overall, during the past three years the deficit contracted more rapidly than we would expect if policy had followed the typical historical pattern given the weak pace of the recovery.
- Over the next couple of years, based on CBO projections of the deficit and the output gap, the deficit’s pace of decline is expected to slow, and it should line up more with the historical pattern as economic conditions improve.
The views expressed are those of the author, with input from the forecasting staff of the Federal Reserve Bank of San Francisco. They are not intended to represent the views of others within the Bank or within the Federal Reserve System. FedViews appears eight times a year, generally around the middle of the month. Please send editorial comments to Research Library.