The question of the correct way to measure inflation is an important one. Price stability over time, along with "maximum" sustainable economic output and employment, are the Federal Reserve’s primary goals in making monetary policy. The maintenance of price stability—avoiding high inflation rates or deflation over time—is important because fluctuating prices distort the economy’s price signals and can result in the misallocation of resources. 1
The Federal Reserve carefully reviews and analyzes the available inflation measures to monitor how well it is achieving its price stability goal. One common way economists use inflation data is by looking at “core inflation,” which is generally defined as a chosen measure of inflation (e.g., the Consumer Price Index or CPI, the Personal Consumption Expenditures Price Index or PCEPI, or the Gross Domestic Product Deflator) that excludes the more volatile categories of food and energy prices.
Why are food and energy prices typically more volatile than other prices?
To understand why the categories of food and energy are more sensitive to price changes, consider environmental factors that can ravage a year’s crops, or fluctuations in the oil supply from the OPEC cartel. Each is an example of a supply shock that may affect the prices for that product. However, although the prices of those goods may frequently increase or decrease at rapid rates, the price disturbances may not be related to a trend change in the economy’s overall price level. Instead, changes in food and energy prices often are more likely related to temporary factors that may reverse themselves later.
To demonstrate just how volatile energy prices, for example, can be relative to other prices less food and energy, Chart 1 compares the fluctuations of these two measures over time.
Chart 1
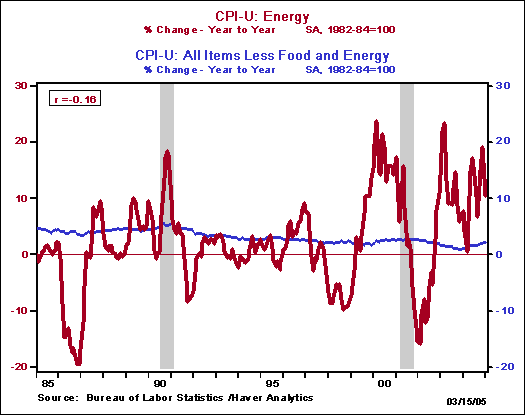
Fluctuations in energy prices are illustrated by the red line, while a trend increase in general prices is represented by the less volatile blue line. 2
Fluctuations in energy prices reflect a change in those prices over time relative to other prices. This means, for example, that increases in the price of oil, an important input of many other goods, will make oil-dependent goods and services (e.g., automobiles) more expensive relative to less oil-intensive goods and services (e.g., bicycles). The important point to note is that the energy price fluctuations displayed by the red line in Chart 1 often resulted from factors other than an underlying trend increase in general prices (the blue line). Therefore, the changes in energy prices are not necessarily a sign of inflation and, when they are included, can distort a trend increase in general prices. By measuring core inflation, economists are attempting to isolate what is happening to general prices without distraction from spikes in volatile energy prices. 3
The PCEPI is another popular measure of inflation. This measure is based on Personal Consumption Expenditures (PCE), which is the component of GDP that includes all consumer spending on durable goods, nondurable goods, and services. To illustrate the important difference between PCE and “core” PCE, the two inflation measures are displayed in Chart 2.
Chart 2
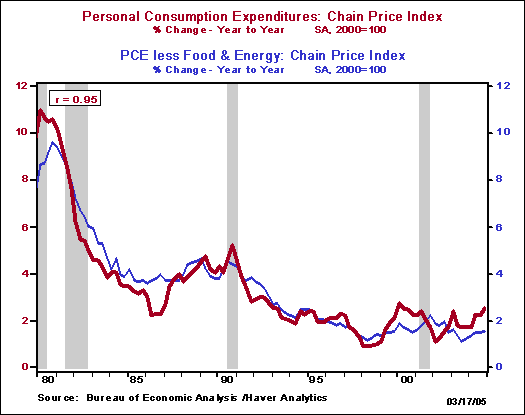
As you can see, the red line shows a bit more fluctuation than the blue line. In other words, leaving out the volatile categories of food and energy yields a more steady measure of inflation, and thus is more likely to reflect the overall trend change in the economy’s general price level.
Should food and energy prices ever be included in measures of inflation?
If economists were to look only at measures of inflation that include expenditures on food and energy, which would include their more-sensitive price fluctuations, they may be fooled into believing that general prices are rising or falling more rapidly than they really are. An additional argument for excluding changes in food and energy prices from measures of inflation is that, “although these prices have substantial effects on the overall index, they often are quickly reversed and so do not require a monetary policy response.” (Motley, 1997)
Having said this, measures of inflation that do incorporate food and energy prices are still useful in many circumstances and are closely followed by economists for clues to the behavior of the overall price level. For example, economists may view the sensitive nature of food and energy prices as a symptom of future overall price increases. “A rise in aggregate demand that might set off a period of higher inflation may initially show up in increases in certain sensitive prices that are set in more competitive markets. If these prices are ignored because they are ‘volatile,’ these early signals of inflation may be missed.” (Motley, 1997).
Determining when to use a core inflation measure versus an overall inflation measure can be a very complicated question. For more information on when and why more inclusive measures of inflation might be useful, please see the San Francisco Federal Reserve’s April 18, 1997 Economic Letter and Gavin and Mandal (2002). 4
Endnotes
1. To illustrate the importance of the price stability objective, note that the Federal Open Market Committee recently discussed the issue of inflation targeting, which is when a central bank’s monetary policy is set with the goal of maintaining a specific level of inflation (see the FOMC’s minutes of the February 2, 2005 meeting: http://www.federalreserve.gov/FOMC/minutes/20050202.htm). Most discussions of inflation targeting recommend targeting a core inflation rate.
2. Average increases over the entire twenty-year period shown in the Chart 1 were 3.2 percent for core CPI, but only 2.4 percent for energy prices. However, the annual change in all prices, shown as the blue line, was narrow, ranging from a low of 1 percent to a high of 6 percent, while the annual changes in energy prices were much larger, ranging from a low of nearly -20 percent to a high of nearly 24 percent.
3. Food and energy are significant components of overall price indexes. The Bureau of Labor Statistics, which calculates the CPI, publishes the weight, or relative importance, of each CPI component. In December of 2004, the general food category accounted for about 14.3% of the total CPI, and energy prices (i.e., the erratic jagged red line in Chart 1) accounted for about 8% of the total CPI. Together they were about 22.3% of the CPI’s “weight”! See Bureau of Labor Statistics: Relative importance of components in the Consumer Prices Indexes (ftp://ftp.bls.gov/pub/special.requests/cpi/cpiri_2004.txt).
4. Gavin and Mandal in the January 2002 Federal Reserve Bank of St. Louis’s Regional Economist argue that food should no longer be excluded from inflation measures in the first place, under the rationale that food prices are not as volatile as they once were due to changing consumption patterns of American consumers.
Further Reading
Baer, Andrew; Haltom, Nicholas; and Peterman, William (2004). “Examining Contributions to Core Consumer Inflation Measures”. Federal Reserve Bank of Atlanta Working Paper Series, April 2004, Working Paper 2004-7
(http://www.frbatlanta.org/filelegacydocs/wp0407.pdf)
Clark, Todd E. (2001). “Comparing Measures of Core Inflation”. Federal Reserve Bank of Kansas City, Economic Review. 86 (2) QII, 2001.
(http://www.kc.frb.org/PUBLICAT/ECONREV/PDF/2q01clar.pdf)
References
Motley, Brian (1997). “Should Monetary Policy Focus on ‘Core’ Inflation?” FRBSF Economic Letter, Number 1997-11, (April 18).
(/econrsrch/wklyltr/el97-11.html)
Gavin, William T.; Mandal, Rachel J. (2002). “Predicting Inflation: Food for Thought”. Federal Reserve Bank of St. Louis, Regional Economist, January 2002.
(http://stlouisfed.org/publications/re/2002/a/pages/lead-article.html)
Personal Consumption Expenditures is measured by the Bureau of Economic Analysis (http://www.bea.gov)
The Consumer Price Index is measured by the Bureau of Labor Statistics (http://www.bls.gov). Also see “How is the Consumer Price Index (CPI) used?” (http://www.bls.gov/dolfaq/bls_ques1.htm).