First, let’s start with some definitions:
What are national saving and the national saving rate?
National saving is the total amount of saving by individuals, businesses, and the government. The national saving rate is national saving measured as a percentage of national income.
What are IRAs and 401(k)s?
Both Individual Retirement Arrangement (IRA) and 401(k) plans are tax shelters for retirement saving. An IRA is the most basic form of retirement arrangement and is available to anyone regardless of employment status. At mid-year 2005, domestic commercial banks in the U.S. held $171 billion in IRA and Keogh Plan—another saving plan—deposit balances.
The 401(k) plan (which gets its name from section 401(k) of the Internal Revenue Code) is an employer-sponsored retirement arrangement. It is a tax-qualified deferred compensation plan, in which an employee can elect to have the employer contribute a portion of his or her cash wages to the plan. In many cases, an employer will match employees’ contributions up to a point.
Tax treatment of IRA and 401(k) contributions is complex in details and differs depending on the type of plan—traditional or Roth. Contributions to traditional plans may be tax deductible (either in whole or in part). However, withdrawals from a traditional plan are subject to tax. Roth arrangements work somewhat in reverse compared to traditional plans. While contributions to these plans are made with after-tax dollars, withdrawals from them at retirement are tax free. The Internal Revenue Service provides detailed information on IRA and 401(k) plans.
Which agency computes U.S. national saving and how can one access this data?
In the U.S., data on the national saving rate is calculated by the U.S. Bureau of Economics Analysis (BEA). These data can be found in the National Income and Product Accounts (NIPA) Tables. NIPA tables and related information are available online from BEA web site.
How is national saving calculated?
As previously mentioned, national saving is comprised of two subparts: public (government) and private saving. Government saving is the difference between government receipts and government expenditures. Private saving is the difference between income and outlays of the private sector. Private saving can be further disaggregated into saving by individuals (personal saving) and saving by firms (retained corporate earnings).
Since IRA and 401(k) contributions are not part of personal outlays (and, therefore, must be included in the difference between personal income and personal outlays), these contributions are included in national saving computations.
| Table 1. U.S. Saving (data as of November 2005)Billions of U.S. dollars Seasonally adjusted at annual rates Source: BEA |
||
|
2005:Q2
|
2005:Q3
|
|
| Net Government Saving |
-276.1
|
-421.6
|
| Net Private Saving |
447.2
|
253.8
|
| Net Personal Saving |
-21.5
|
-158.9
|
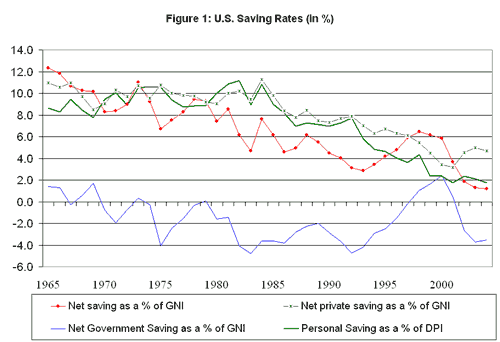
Table 1 shows the data on U.S. government, private, and personal saving (as of November 2005). Figure 1 shows U.S. personal, private, national, and government saving rates for the years 1965-2004 (the chart shows private, government, and the national saving rate as a percentage of gross national income or GNI, and the personal saving rate as a percentage of disposable personal income or DPI).1
Will expansion of incentives for retirement saving boost the national saving rate?
The recent decline in the national saving rate that is evident in Figure 1 has been widely noted by academics and policymakers (see, for instance, Maki and Palumbo 2001, Ferguson 2004, Gramlich 2005, and Lansing 2005). One question that has been debated recently is whether encouraging personal retirement saving (i.e., stimulating an increase in 401(k) or IRA contributions) would be an effective measure to boost the low national saving rate.
The answer to this question is not clear. An increase in IRA contributions, for example, could arise from households’ reduction in other asset holdings as opposed to a reduction in consumption (see Attanasio and DeLeire 2002). In that case, households would not change their saving rate and, therefore, there would be no change to the private saving rate. Even if an increase in IRA contributions would cause an increase in private saving, one ought to remember that it could also result in a reduction in federal tax revenue. A fall in federal tax revenue could possibly lead to a reduction in government saving and, consequently, put downward pressure on the national saving rate (Gramlich 2005).
References
Attanasio, Orazio and Thomas DeLeire. 2002. “The Effect of Individual Retirement Accounts on Household Consumption and National Saving.” The Economic Journal 112 (6), pp. 504-538.
Ferguson, Roger W. 2004. "Questions and Reflections on the Personal Saving Rate.” Speech to the National Bankers Association, Nashville, Tennessee.
Gramlich, Edward M. 2005. “The Importance of Raising National Savings.” Speech at the Benjamin Rush Lecture, Dickinson College, Pennsylvania.
Lansing, Kevin. 2005. “Spendthrift Nation.” FRBSF Economic Letter 2005-30 (November 10).
Maki, D. and M. Palumbo. 2001. “Disentangling the Wealth Effect: A Cohort Analysis of Household Saving in the 1990s." Federal Reserve Board Finance and Economics Discussion Papers.
Reinsdorf, Marshall B. 2004. “Alternative Measures of Personal Saving.” Survey of Current Business 84: 17-27.
Strawser, Cornelia, ed. 2002. Business Statistics of the United States. 2002. Lanham, MD: Bernan Publications.
Endnotes
1. Data on national saving, private saving and government saving can be found in NIPA table 5.1 (“Saving and Investment”). Data on personal saving can be found in NIPA table 2.1 (“Personal Income and Its Disposition”). Data on national income can be found in NIPA table 1.7.5 (“Relation of Gross Domestic Product, Gross National Product, Net National Product, National Income, and Personal Income”).