This is a two-part answer; Dr. Econ will answer this question by addressing both the housing market’s effect on jobs (December 2006), and the housing market’s potential effects on other sectors in the economy (January 2007).
That is an excellent question, and a timely one to consider as the housing slowdown that started in late 2005 continues into the second half of 2007 (when this response was written). One good source of information for examining economic activity by any sector, including the construction industry and other sectors influenced by the construction industry, is the nonfarm payroll employment series published by the Bureau of Labor Statistics (BLS). These seasonally adjusted data are published monthly, providing a time series of residential and nonresidential construction employment, as well as jobs in sectors that may be directly affected by changes in construction activity. We’ll look at a snapshot of these jobs data as of June 2007 to answer your questions.
Signs of the most recent housing slowdown were first seen in late 2005 in key housing construction indicators, like housing starts and housing permits. Construction jobs data now reflect the slowdown in new activity that occurred several quarters earlier. Though lagging new activity, the employment data provide information on jobs in residential construction, nonresidential construction, and engineering and heavy construction activity, allowing analysts to track industry developments by sector. These employment data also are available by state and by metropolitan area, so analysts can compare national and regional employment trends.
Construction jobs: More volatility than total jobs
First, let’s look at how construction job growth rates vary over time compared to total jobs. Nationally, in June 2007 construction jobs totaled about 7.7 million, out of about 138 million nonfarm payroll jobs. Thus, construction accounted for about 5.6% of all payroll jobs in June 2007, which makes it a relatively small share of payroll employment compared to other sectors like private service-producing industries (67.6%), government (16.2%), or even manufacturing (10.2%).1
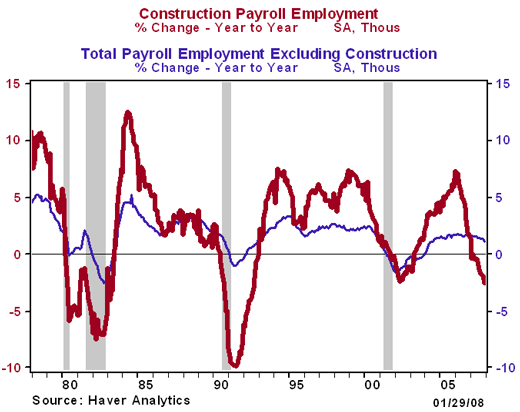
Construction jobs tend to show much wider swings in growth rates than total employment less construction. This can be seen in Chart 1, which compares the year-over-year growth rate for construction jobs (thick red line) and total jobs excluding construction jobs (thin blue line). The downturns in construction employment growth rates have often preceded overall business cycle downturns, shown as the shaded recession bars in the charts, and during most of these slowdowns construction jobs have fallen much faster than total nonfarm payroll jobs excluding construction jobs.
Chart 1: Construction job growth varies more than total employment less construction2

Recent construction job slowdown
Within the most recent housing slowdown (see Chart 1), seasonally adjusted data reveal that the overall construction job growth rate over the prior 12-month period fell to zero or turned negative for construction jobs in five of the first six months of 2007. As recently as the first quarter of 2006, construction jobs were expanding at a 7.2% annual rate, much faster than the overall growth rate of 1.8% for total payroll jobs excluding construction jobs. The growth rate for total payroll jobs excluding construction jobs has shown little change over the past year, indicating that at least as of mid-year 2007, the dramatic slowdown in overall construction jobs has not spread to the overall economy, nor has it been as severe as any of the prior four recessions.
What types of construction jobs have slowed?
Let’s look at some of the detailed construction jobs data to see how much of that slowdown can be attributed to housing construction, as opposed to construction of commercial real estate or heavy construction.
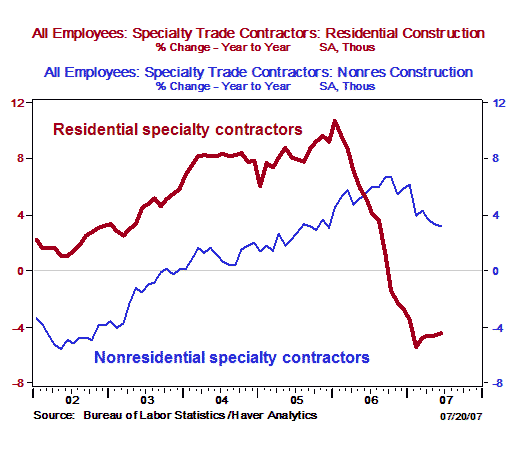
The most dramatic weakness over the 12-month period ending in June 2007 has been in jobs for specialty trade contractors engaged in residential construction. This category of jobs, shown as the thick red line in Chart 2, includes contractors for, among other things, poured concrete structures, framing, and roofing, all of which have seen large declines within the recent slowdown. In contrast to the downturn in residential jobs, specialty trade contractors engaged in nonresidential construction have seen a slowdown in their rate of job growth, but job growth remained positive over the same period (thin blue line) as commercial real estate construction activity has generally continued to expand.
Chart 2: Job growth has slowed for nonresidential specialty contractors, but has actually declined for residential specialty contractors

Other sectors also are affected
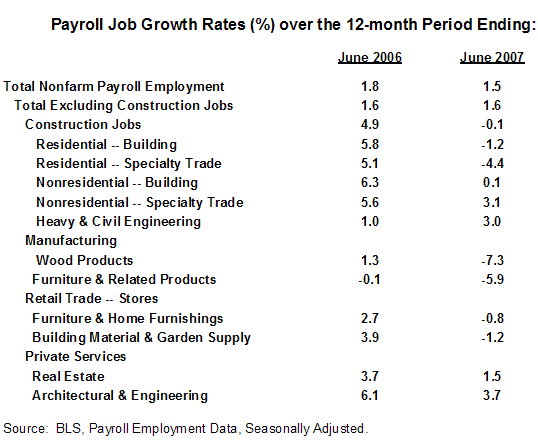
Your question also asks about jobs in sectors outside of residential housing that may be affected by the slowdown in residential construction activity. The BLS jobs data indicate that job growth rates in the sectors that tend to be highly correlated with movements in construction activity also have been affected by the slump in residential housing activity. Table 1 shows payroll job growth rates for several such sectors. One can see that in the manufacturing sector, employment in wood products and furniture & related products has declined sharply over the past year, falling 7.3% and 5.9%, respectively. Employment in the retail trade sector has also been affected: stores selling furniture & home furnishings and building materials & garden supplies, which had rapid job growth a year earlier, both lost jobs over the past 12 months (at close to a 1% annual rate). While jobs continued to increase over the past 12 months in both real estate and architectural & engineering services, the rate of growth for both has fallen considerably, to 1.5% and 3.7%, respectively, from a year earlier.
Table 1: Job performance has slumped in sectors affected by the housing slowdown

You can see that the payroll jobs data provide a wealth of information about the economy. Going forward, you can use these data from the BLS website to track trends in employment by industry at the national, state, and metropolitan area level. Good luck!
There are other ways to monitor the impact of the housing sector on the economy beyond jobs data. For January 2007, Dr. Eco
n looks at how conditions in the housing sector affect gross domestic product (GDP).
Footnotes
1. These numbers are all taken from June 2007 data.
2. The chart indicates that “r=0.83,” which means that the correlation coefficient of total payroll employment excluding construction jobs and construction employment is 0.83, indicating that these two data series move together closely over time