Good news: The Board of Governors of the Federal Reserve System produces statistics on housing assets, mortgage debt and housing net worth. Let me walk you through these key economic indicators.
Household Balance Sheet: Net Worth
The Federal Reserve Board estimates household balance sheet data as a component of its quarterly Z.1 Flow of Funds Accounts of the United States Statistical Release (“Flow of Funds”). Table B.100 of that release contains information on tangible (real property, durable goods) and financial (deposits, U.S. Treasury securities, corporate bonds, corporate equities, pension reserves, etc.) assets and liabilities (mortgage loans, consumer loans, etc.) of U.S. households (farm and nonfarm) and non-profit organizations. Since here we are discussing net worth as it relates to housing, it is worth noting that real property accounts for a large share of household assets—ranging from 24 percent to 33 percent of total household assets and 77 percent to 85 percent of tangible household assets during the past 10 years.
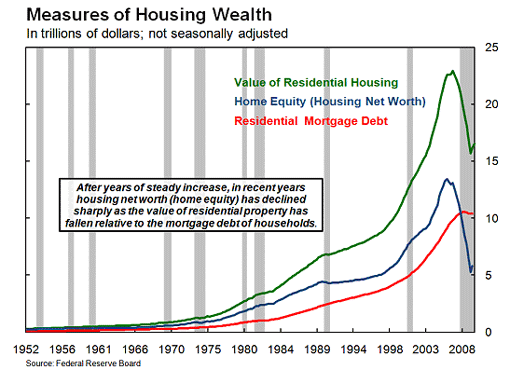
Chart 1 Housing Net Worth (Equity) and Mortgage Debt

Chart 1 plots the market value of residential real estate, household mortgage debt and housing net worth. Housing net worth, commonly referred to as home equity, is the difference between the value of homes owned by households and the mortgage debt owed on those homes. As Chart 1 shows, housing net worth tended to rise relatively steadily for more than 50 years because house price appreciation outstripped increases in mortgage debt owed by households. This was especially true during the housing boom from the late 1990s through 2005. Note that even during the previous recession (recessions are shown as grey bars), which occurred in 2001, housing net worth kept rising rapidly. This contrasted with the typical pattern seen in earlier recessions.
Since 2006 the story has changed dramatically with a virtual nationwide drop in house prices (for additional information on the housing downturn and how it affected the broader economy, please visit the FRBSF Web site, The Economy: Crisis & Response). Even taking into account some new housing construction, the estimated value of residential real estate in the U.S. fell by nearly $7 trillion from early 2006 until early 2009 as housing value dropped to a low of about $15.6 trillion in the first quarter of 2009; far below its peak of $22.6 trillion in the first quarter of 2006. Housing net worth declined by $8 trillion over the same period as mortgage debt rose by $1 trillion.
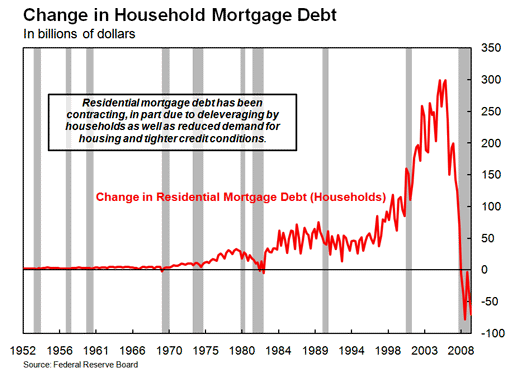
Second and third quarter 2009 data show a small upturn in housing net worth. This reflects both the modest improvement in home prices and the contraction of mortgage debt. As illustrated in Chart 2, the recent six-quarter (through the third quarter of 2009) net contraction in residential mortgage debt is highly unusual. The reduction in mortgage debt reflects deleveraging (as households work to repair their balance sheets), reduced demand for housing, tighter credit standards, and the extinguishing of debt associated with higher rates of mortgage foreclosures.
Chart 2: Change in Residential Mortgage Debt Owed by Households

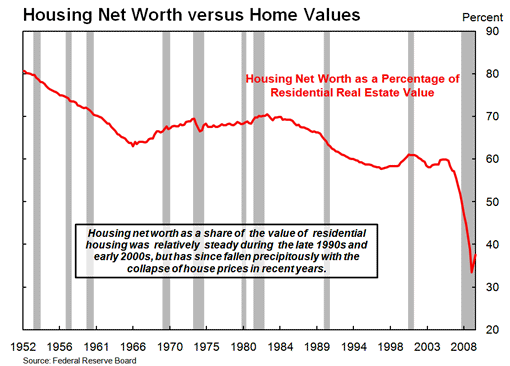
Another way we can look at these relationships is by examining housing net worth relative to the total value of housing. That is, we can look at what has happened to the average share of equity homeowners have in their houses. Chart 3 plots the ratio of housing net worth to the total value of residential real estate:
Chart 3 Housing Net Worth as a Share of the Value of Residential Real Estate

During the housing boom that took place from the late 1990s through the first half of the 2000s, the ratio of total housing net worth to the value of residential real estate was about 0.6. In other words, the average homeowner’s equity represented about 60 percent of the value of their house. Note that this is just an average; some homeowners with no mortgage debt had 100 percent equity shares, while others had much smaller equity shares in their homes.
The collapse in the housing market and the decline in home values have together pushed homeowners’ average equity shares to exceptionally low levels (as of the third quarter of 2009, the ratio was 0.38 , i.e. the average homeowners’ equity declined by more than 20 percentage points to about 38 percent). Again, the average masks a large degree of variation in equity shares. In particular, many homeowners who made purchases in the latter part of the housing boom with little-or-no down payment are currently “underwater”, meaning the value of their mortgages exceeds their home’s value.
Additional Resources
For more on household net worth and mortgage debt see:
Doms, Mark and Motika, Meryl (2006). “Property Debt Burdens”. FRBSF Economic Letter 2006-18.
Lansing, Kevin J. (2005). “Spendthrift Nation”. FRBSF Economic Letter 2005-30.
For additional information on the downturn in housing and the financial crisis, please see:
The Economy: Crisis & Response, Web site, FRBSF.