
As the yield curve has continued to flatten, worries about recession risk have increased. However, according to conventional metrics, the current yield curve is not inverted and therefore does not predict a recession in the near future.
Perhaps the single most reliable way to see into the economic future is the yield curve—the relationship between maturities and interest rates on government bonds. The yield curve captures the cost of borrowing money to finance consumption, investment, or government spending and thus is of central importance to the entire economy. Its shape turns out to be an excellent predictor of future economic activity.
Yield curves generally come in three different shapes—normal, flat, and inverted—which are characterized by long-term interest rates being above, similar to, or below short-term interest rates. In the United States and many other countries, an inverted yield curve invariably signals a future economic slowdown. In fact, every U.S. recession in the last 60 years was preceded by an inversion (Bauer and Mertens 2018a). While different theories could account for this empirical phenomenon, part of the explanation is undoubtedly the forward-looking nature of long-term interest rates, which incorporate investor expectations about the future economic outlook.
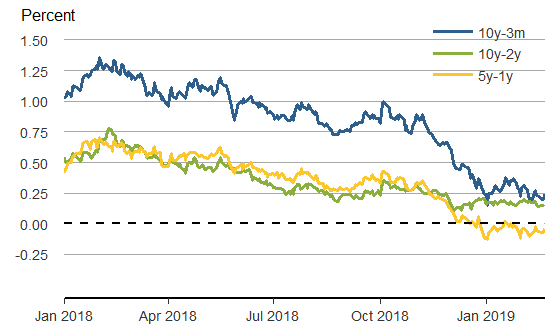
Recent shifts in the Treasury yield curve have prompted extensive discussion in the news about the possibility of a recession. Figure 1 shows the evolution of three different Treasury yield spreads since the beginning of 2018. The gradual downward trend in spreads turned into a more sudden decline since last November, as long-term Treasury yields fell due to downward revisions of the global growth outlook, uncertainty over global trade, and a perceived shift in communication from Fed officials, among other factors. In December, some yield spreads turned negative, including the difference between the five-year and one-year yields, which has remained between –5 and –10 basis points (hundredths of a percentage point) for most of 2019. Some commentators have viewed this as the beginning of a yield curve inversion and a signal of an impending recession.
Figure 1
Different yield spreads are sending mixed signals
A yield curve inversion is defined as an episode when short-term interest rates, including the federal funds rate, rise above long-term rates. However, today’s yield curve still slopes upward, if only slightly so, with the ten-year Treasury yield about 20 to 30 basis points above the three-month yield and the federal funds rate.
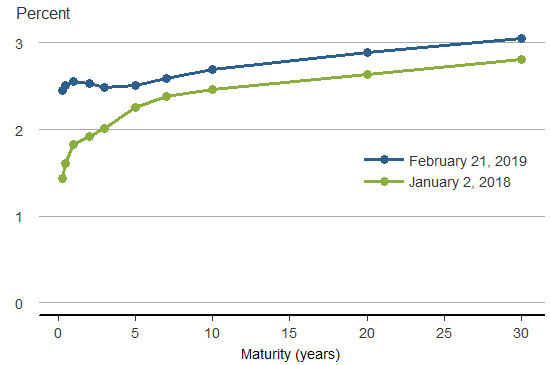
Visual inspection may be the single best way to judge the shape of the yield curve. Figure 2 plots the recent Treasury yields in comparison to the levels in the beginning of 2018. The yield curve has shifted up, flattened somewhat, and now has a slight “dent” at maturities from one to five years, where yields decline with maturity. But it currently is not inverted according to the usual definition.
Figure 2
Yield curve has shifted in the past year
What single number best summarizes the shape of the yield curve? That is, which term spread (difference between interest rates of different “terms” or maturities) should we focus on?
When it comes to forecasting future economic activity, the most informative measures of the shape of the yield curve are spreads between long-term and short-term interest rates. The classical measure for this purpose is the difference between the ten-year and three-month Treasury yields (10y-3m). This is also our preferred spread measure because it has the strongest predictive power for future recessions (Bauer and Mertens 2018b). The recent downward trend in this spread is somewhat disconcerting, as it mechanically makes a future yield curve inversion more likely. But model-based analysis by Christensen (2018) suggests that the likelihood of an inversion may not have risen by much, and most professional forecasters, including the Blue Chip survey, predict that the yield curve will return to normal without inverting. At this point there still is a cushion of about one-quarter percentage point in this spread, and history has seen similarly low levels (for example, in 1995 and 1998) without a recession following soon thereafter. If this spread turned distinctly negative, it would be a worrying sign for the U.S. economic outlook, but we are still some distance from that.
What about other spreads? The often-quoted spread between the ten-year and two-year yields is slightly lower, around 15 to 20 basis points. In a recent Economic Letter, we showed that this measure has slightly worse predictive power than the more common 10y-3m spread (Bauer and Mertens 2018b). Intuitively, its main drawback is that expectations over the next two years—which may well be informative about the economic outlook—are differenced out. The persistently negative spread between five-year and one-year yields is more worrying. We found that this spread has almost as strong predictive power as other, more commonly used spreads; a statistical model based solely on this measure would predict a recession in the near future. However, this “middle-of-the-curve” spread ignores useful information at the long and short ends of the yield curve, which are incorporated into our preferred spread. Also, conflicting messages from individual spreads should not overshadow the fact that, on the whole, the yield curve slopes upward. Furthermore, the historical evidence is mixed: episodes with a similar “dent” in the middle of an upward-sloping yield curve have sometimes been followed by a true inversion and sometimes by a normalization of the yield curve, without a recession in the near future.
Overall, the current shape of the yield curve is somewhat worrisome. It has flattened substantially, making a possible future inversion more likely, and it is sending conflicting messages in that some parts of the curve now slope downward. But it is important to note that the yield curve is not fully inverted, and our preferred spread measure remains positive. Indeed, a yield curve flattening usually accompanies a period of monetary policy tightening—when the Fed raises its policy rate. Overall, before we see a clear inversion of the yield curve, it is too early to predict a recession in the near future.
Michael D. Bauer is a research advisor in the Economic Research Department of the Federal Reserve Bank of San Francisco.
Thomas M. Mertens is a senior research advisor in the Economic Research Department of the Federal Reserve Bank of San Francisco.
References
Bauer, Michael D., and Thomas M. Mertens. 2018a. “Economic Forecasts with the Yield Curve.” FRBSF Economic Letter 2018-07 (March 5).
Bauer, Michael D., and Thomas M. Mertens. 2018b. “Information in the Yield Curve about Future Recessions.” FRBSF Economic Letter 2018-20 (August 27).
Christensen, Jens H.E. 2018. “The Slope of the Yield Curve and the Near-Term Outlook.” FRBSF Economic Letter 2018-23 (October 15).
The views expressed here do not necessarily reflect the views of the management of the Federal Reserve Bank of San Francisco or of the Board of Governors of the Federal Reserve System.