A few weeks ago, I met a young man with a warehouse job. He was worried. He shared that he had just called in sick to his employer. When I asked him if it was COVID, he told me no. He just couldn’t afford the gas that day and still manage to pay his rent.
Now it would be of little consolation to him to learn that much of the inflation we see today is driven by supply chain bottlenecks or the ongoing war in Ukraine. Nor would he be relieved to learn that excess demand, supported by fiscal and monetary policy aid and a robust recovery, were to blame. All he and so many others want to know is, when will this end?
So, let me start by saying here what I said to him: Bringing inflation down is the Federal Reserve’s number one priority right now. And we have the tools and the will to do it.
But we actually want to do more than that. We want to bring inflation down without crippling growth and stalling the labor market.
Afterall that is the dual mandate. Our job is to ensure that Americans everywhere have opportunities to earn a living and the confidence that the living they earn will hold its value.
So today, I will talk about how we can achieve that. But first, let me remind you that the views I share are my own and do not necessarily reflect those of anyone else within the Federal Reserve System.
Evolving Risks
To understand the path going forward, we first need to understand how we arrived here. So, let’s start there.
The earliest signs of rising inflation pressures came in the spring of 2021. At that time, overall inflation was running below the Fed‘s 2 percent target, as it had been for over a decade.
But conditions were changing. Fiscal and monetary policy support were charging through the system, boosting demand for a variety of goods. At the same time, COVID was still ravaging supply chains, disrupting production and distribution, and leaving accumulated backlogs for a range of products.
The challenges were apparent. Consumers were robustly purchasing goods, while suppliers were having trouble making and delivering them. And as we would expect, price pressures emerged.
But since high inflation readings were mainly limited to sectors most directly affected by the pandemic, and newly developed vaccines promised to knock out—or at least significantly temper—COVID, few people viewed high inflation over a longer period as inevitable.1 Indeed, at that time the overwhelming consensus among policymakers and economists more broadly was that upward and downward risks to inflation were balanced.
Financial markets generally agreed. In line with most forecasts at the time, markets perceived that the risk of high inflation was elevated. But they did not see this as the only—or even the most likely—scenario.2 In fact, a broad range of indicators pointed to the possibility that inflation would settle lower, not higher once the pandemic was behind us.
Recall that for over a decade preceding the pandemic, central banks across the globe had found it difficult to get inflation up to target.3 Structural forces including changing demographics, slower productivity growth, more global price competition, and weaker links between wages and prices persistently exerted downward pressure on inflation and inflation expectations.4
In other words, at that time the risk landscape on future inflation was decidedly two-sided. We could act preemptively to stave off the potential for broadening price pressures only to find inflation once again too low, or we could wait until the path of inflation was clearer and find ourselves with inflation too high.
To manage these risks we needed to do more than just assess their likelihood. It was also important to stack the potential outcomes against the tools we had to deal with them. Unfortunately, with the proximity of the zero lower bound our tools are not symmetrically effective. When inflation is too high, we have ample room to raise the federal funds rate to pull it back down. But when inflation falls too low, and the zero lower bound binds, we have to rely on less robust tools, such as asset purchases.5
This meant there could be significant potential costs to overreacting based on emerging—but still limited—evidence of price pressures. Especially when any premature tightening would be hard to reverse and its consequences could hamper growth and productivity in the longer run.6
All of this tilted my thinking toward a balanced approach, one that weighed the early signs of price pressures against the still-recovering job market and a policy toolkit more readily able to fight misses on the inflation upside than on the downside.7 This assessment was supported by data showing that longer-run inflation expectations among households, businesses and market participants remained well anchored.8
But of course, by fall of 2021, the risks of persistently high inflation readings had become a reality, and forecasts showed little relief on the horizon. COVID continued to surge across the globe. Vaccine uptake had plateaued. And price pressures were spreading outside those sectors most directly affected by the pandemic.9
The Power of Communicating
The evolving landscape meant that monetary policy had to pivot. And it had to do so quickly.
To some of you, that may sound like a contradiction. Monetary policy is usually associated with gradual adjustments that transmit through the economy with long and variable lags. It is not typically associated with agility and speed.10
But just as the risks facing the economy have evolved, so has our policy approach, which can respond more nimbly now to incoming data than it could in the past.
This evolution stems largely from an evolution in the Fed’s communication. Today, the Federal Open Market Committee (FOMC) is transparent about its reaction function and expected outlook. This enables the committee to signal policy adjustments long before they are actually made. And these signals transmit increasingly rapidly into the behavior of financial markets and the economy.11
For example, in the fall of last year, as incoming information confirmed that persistent and broad price pressures were forming, FOMC participants signaled that the future path of policy would likely be tighter. The December FOMC statement and the Summary of Economic Projections (SEP) moved sharply relative to previous releases, projecting an earlier date of liftoff and a faster pace of rate hikes than previously anticipated. At the same time, we communicated that the balance sheet would adjust accordingly.
Following this forward guidance and prior to any actual movements in the funds rate, yields on Treasuries across all durations rose, and rates in other markets followed suit. Mortgage rates, for example, started an ascent that currently puts them at their highest levels in a decade.
While adjustments in financial markets after FOMC communications are not unusual, the speed and magnitude of the movements during the past six months have been unprecedented, as the figure shows.
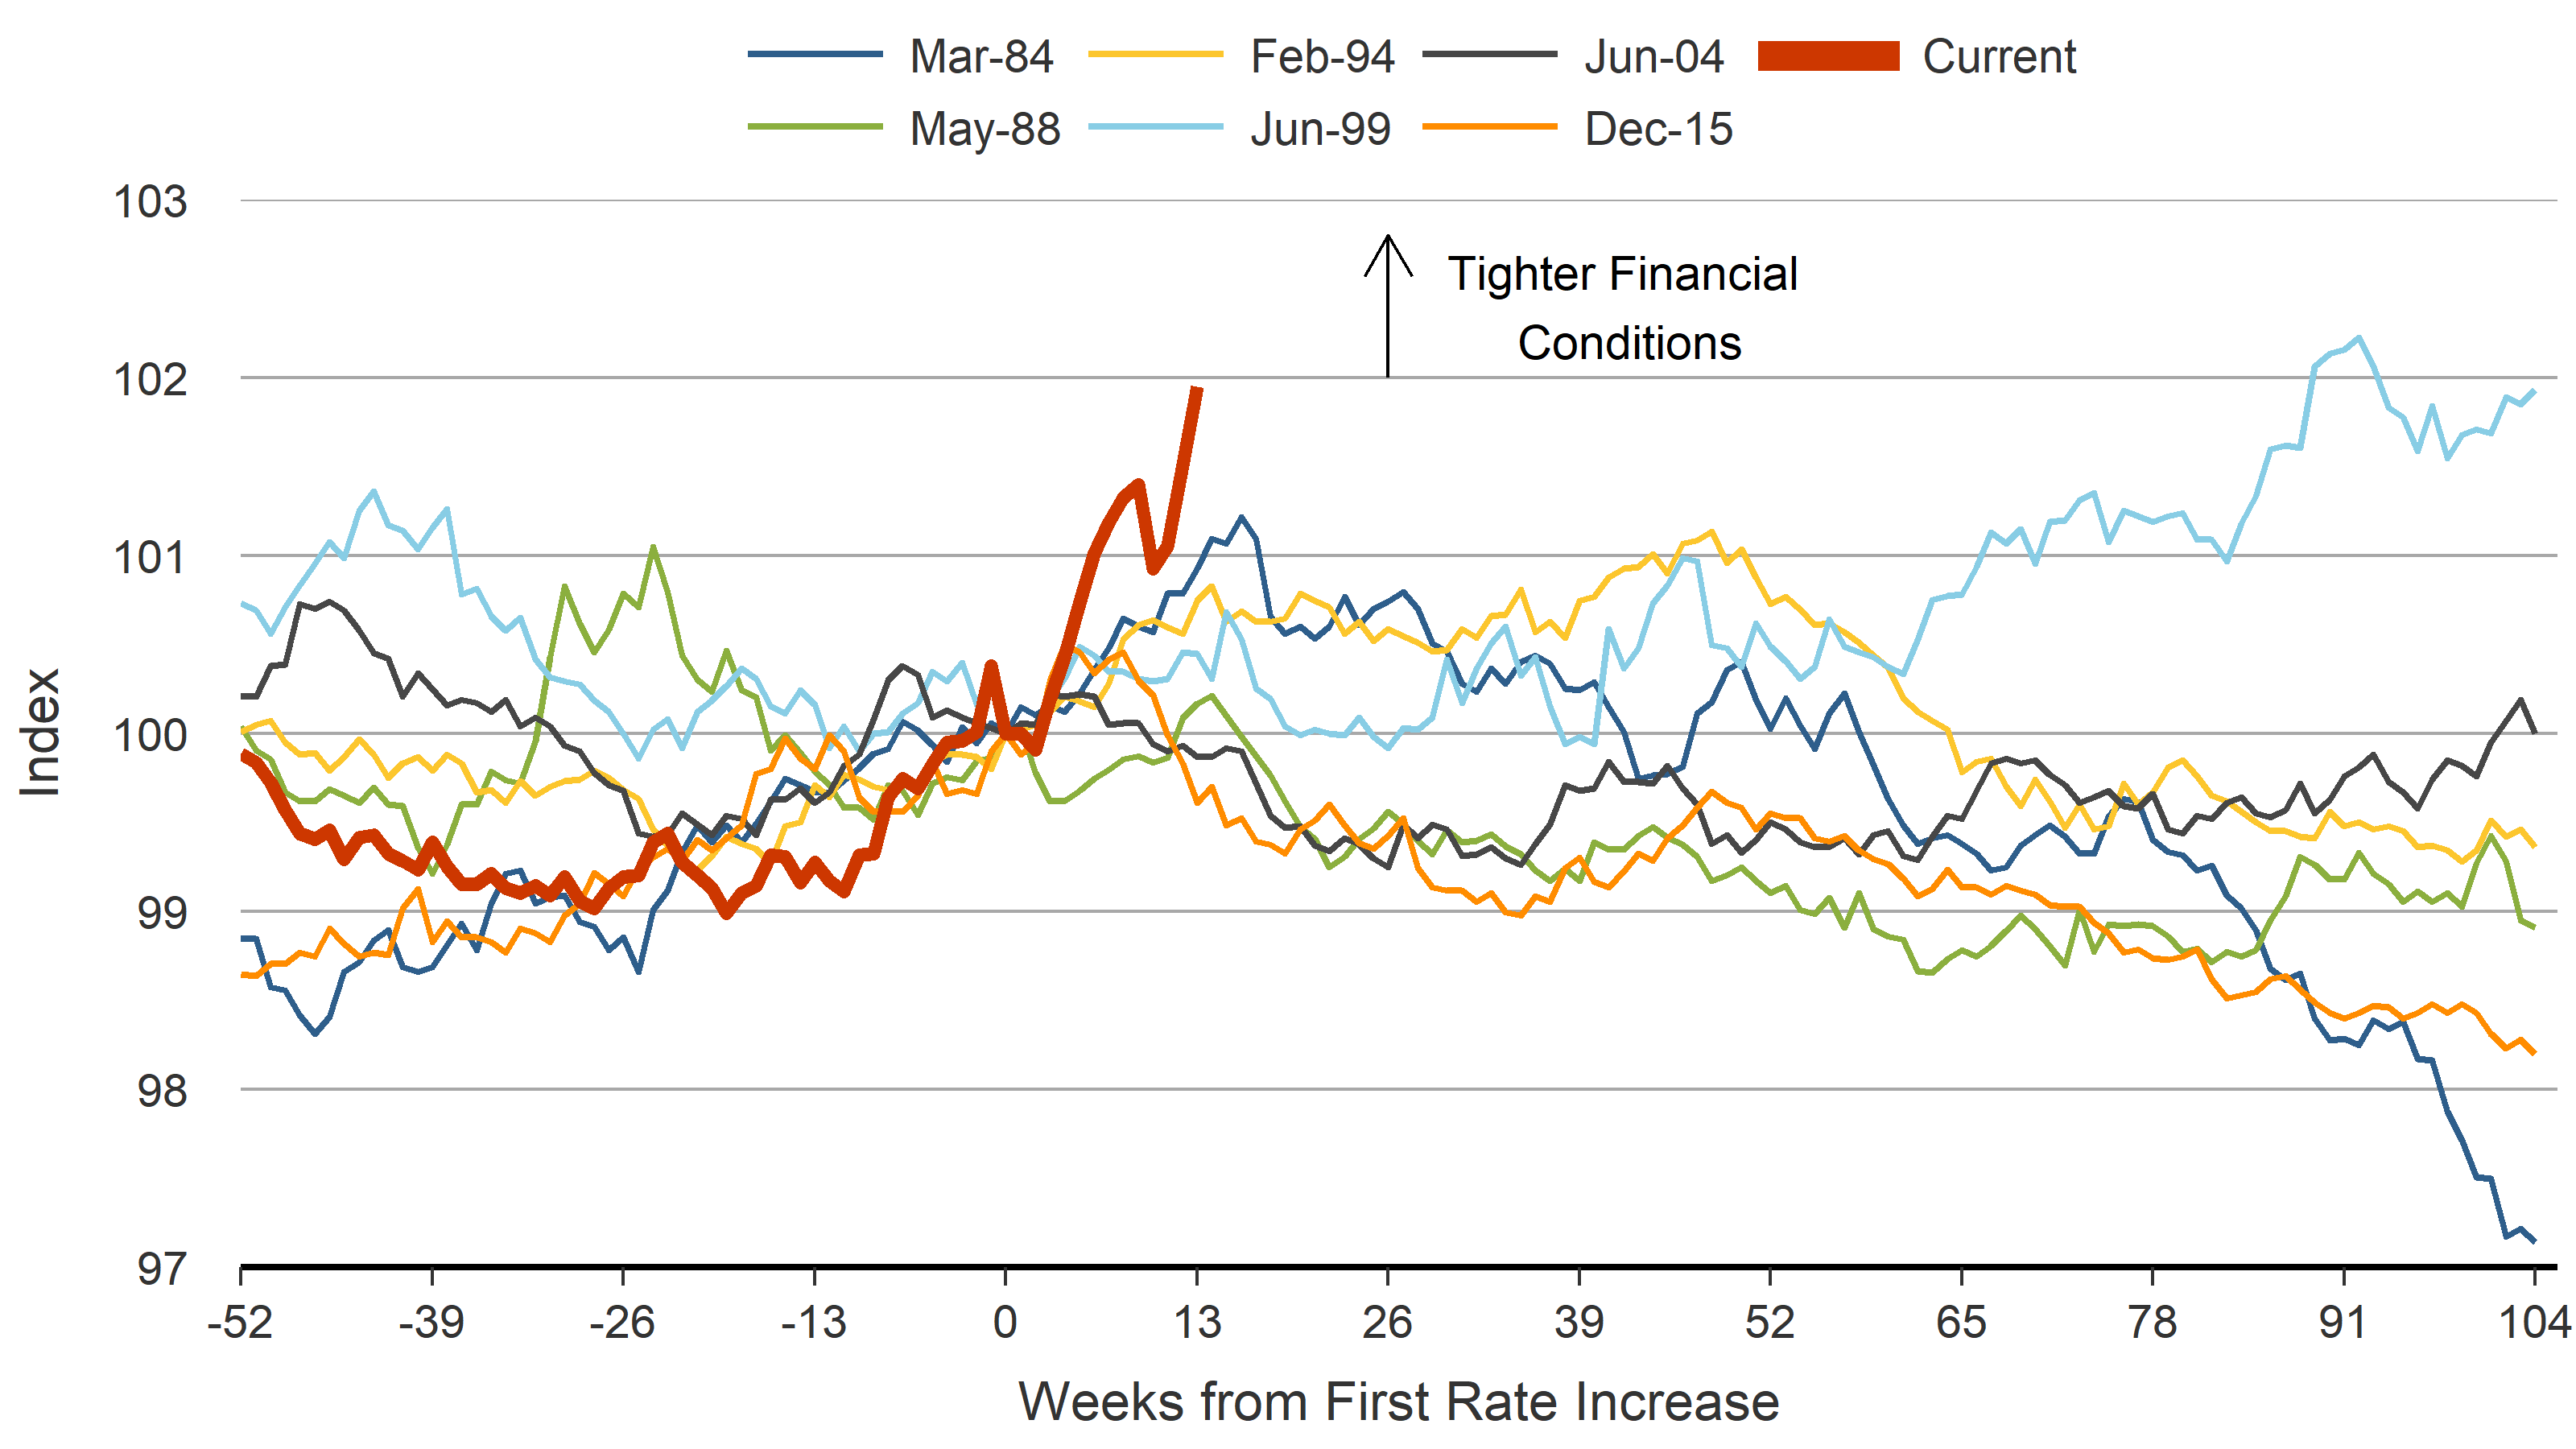
Source: Goldman Sachs and FRBSF staff calculations.
As financial conditions have tightened, some leading indicators of economic activity have softened, especially in interest-sensitive sectors, such as housing. And consumers have expressed caution more broadly, recognizing the impact of expected higher rates on their future borrowing prospects.12
The fact that financial conditions and real activity are adjusting to expected monetary policy tightening, even when actual rates have not fully risen, means that long and variable lags may not be as long, or variable, as typically assumed. And that supports policy nimbleness, allowing monetary policy to be tighter than the actual level of the Fed Funds rate would suggest.
But guidance requires action. And here is how I see that work evolving.
From Risks to Realities
Last week, the FOMC increased the funds rate by 75 basis points and signaled that further rate hikes of a similar magnitude are likely.13 This was the largest single meeting increase since 1994 and puts policy on an expeditious path to neutral by the end of the year. After that, I see additional tightening beyond neutral as the likely next step.
How much additional tightening will be required depends on a number of factors that fall outside of the Fed’s direct control, including the speed and magnitude of supply chain recovery, the duration of the war in Ukraine, and the willingness of individuals who have left the labor force to reenter.14
Just as 2021 required navigating a broad range of possible outcomes, policymaking now is also about managing risks. If supply continues to fall short and inflation remains high, we will need to do more. If conditions improve and supply bounces back, we can do less.
Regardless of which path we take, there will likely be some slowing in the economy. That’s how monetary policy works. We remove accommodation or adjust rates into more restrictive territory, and growth slows and the labor market cools.
The question is: how much economic slowing are we likely to see? Here, history gives us some useful reference points.
One is the Great Inflation of the 1960s and ’70s and the subsequent Volcker disinflation, which, by the mid-1980s, had brought inflation down from its double-digit peak. But it came at a very high cost, pushing the economy into what was then the most severe recession since the Great Depression.
But this is not the only example or precedent of how the economy reacts to policy tightening. In the mid-1990s policymakers faced a rapidly declining unemployment rate and worried that a 1970s-style high inflation environment was coming. So they raised interest rates by 3 percentage points in roughly a year. This rapid policy tightening put the brakes on falling unemployment, but the overall effects on growth were mostly benign. Most notably, the economy and the labor market maintained a relatively strong expansion through the end of the decade, and inflation remained in check.15
For a number of reasons, I expect our economic transition now to look more like the mid-1990s than like the 1970’s Great Inflation and subsequent painful disinflation. That’s because many of the factors that helped fuel the Great Inflation are not as prominent today.
For example, part of the surge in inflation during the 1960s and ’70s was because policymakers overestimated economic and labor market potential.16 These policy misses were exacerbated by widespread wage indexation that contributed to a wage-price spiral. But today’s policymakers use a broader and more robust range of data to assess the economy’s potential performance, and the link between wages and prices is far weaker than it was in the past.17
The Federal Reserve is also different than it was back then. We are a far more transparent institution now. We regularly share our views about the economy, our goals, and our expected policy path. This tells markets and the public more generally what we are thinking and how we are likely to react as the economy changes. This consistent communication has helped keep longer run inflation expectations anchored despite persistent months of high inflation readings. It also has allowed us to respond to evolving data more nimbly and influence the behavior of financial markets and the economy more quickly.
Finally, conditions in the economy are quite different now than they were in the Great Inflation. There is a sizeable amount of excess demand in both product and labor markets, supported by COVID related fiscal and monetary policy. This translates into large, accumulated back orders for goods and historically high job vacancies in the labor market. Adjusting rates to slow the economy will most likely reduce these backlogs and high job vacancies before digging into current production and employment.
In economics terms, this would mean that we are on the steep portion of a fixed supply curve or Beveridge curve.18 And moving along those curves by reducing aggregate demand to return normal conditions would bring inflation down with a more limited effect on overall economic activity.19
In its extreme form, this implies that policy adjustments to lower inflation will be cost free. While I think that scenario is highly unlikely, I do expect the costs of adjustment to be moderate, with some slowing of GDP growth below its longer-run trend and an increase in the unemployment rate from the very low levels we see today.
This would, to my mind, constitute a relatively smooth transition from a pandemic-wracked, highly accommodative economy to one in which tighter policy supports both full employment and price stability.
That is the future that I am working toward.
Commitment
Creating that future will not be easy. Some have called it a narrow path.
But we know the direction we need to head, we understand the risks we face, and we have the tools to respond to a range of conditions however they emerge.
Most importantly, we have the will to act. Not just for this moment, but also for similar events in the future. Always recognizing that our decisions affect every American and no one should have to choose between fueling up to get to work and paying rent to keep their home.
Thank you.
Footnotes
1. Shapiro (2020, 2021). By April 2021, roughly a third of the U.S. population had received at least one dose and about a fifth had been fully vaccinated. https://ourworldindata.org/covid-vaccinations?country=USA
2. In early 2021, markets saw a roughly 33 percent chance that consumer price index inflation would average more than 3 percent over the subsequent 5 years. https://www.minneapolisfed.org/banking/current-and-historical-market–based-probabilities
3. Jordà et al. (2019b).
4. Basu and Fernald (2002), Fernald and Li (2019), Crump et al. (2019), Carvalho, Ferrero, and Nechio (2017), and Jordà et al. (2019a).
5. Cúrdia, Chen, and Ferrero (2012).
6. Ajello et al. (2021).
7. As of March 2021, there were 8.1 million fewer workers on payrolls than pre-pandemic. However, the distribution of worker shortfalls varied across sectors and states (Albert, Foerster, and Sarte 2021).
8. In March 2021, Daly (2021a) noted that inflation compensation over the next 5 years and 5-10 years ahead had only recently risen to roughly 2 percent.
9. Lansing, Oliveira, and Shapiro (2022) and Shapiro (2022).
10. Friedman (1961) and Rudebusch (1995).
11. The Fed did not begin releasing post-FOMC statements until the mid-1990s. A series of measures to increase transparency followed, including the Summary of Economic Projections, the announcement of a 2 percent inflation target, and an accompanying policy framework that was revised in 2020.
12. For example, consumer perceptions and expectations about access to credit have declined. https://www.newyorkfed.org/newsevents/news/research/2022/20220613
13. In its March SEP, the Fed’s median projection for the federal funds rate was 1.9 percent by the end of this year and 2.8 percent by the end of 2023 (Board of Governors 2022b). In June, the SEP projected a revised median funds rate of 3.4 percent by year-end, and 3.8 percent by the end of 2023 (Board of Governors 2022a).
14. An estimated 2 million fewer immigrant workers joining the U.S. labor market since 2020 relative to the pre-pandemic trend (Peri and Zaiour 2022) has added to the headwinds constraining labor supply.
15. See Blinder (2022) for additional discussion of past tightening.
16. Daly (2022).
17. Daly (2021b).
18. The Beveridge curve depicts a systematic relationship between job openings and unemployment, which becomes very steep at low unemployment rates. See Waller (2022).
19. Powell (2022).
References
Ajello, Andrea, Isabel Cairó, Vasco Cúrdia, and Albert Queralto. 2021. “The Asymmetric Costs of Misperceiving R-star.” FRBSF Economic Letter 2021-01 (January 11).
Albert, Sarah, Andrew Foerster, and Pierre-Daniel G. Sarte. 2021. “Employment Effects of COVID-19 across States, Sectors.” FRBSF Economic Letter 2021-32 (November 22).
Basu, Susanto, and John G. Fernald. 2002. “Aggregate Productivity and Aggregate Technology.” European Economic Review 46(6, June), pp. 963–991.
Blinder, Alan. 2022. “Alan Blinder on Landings Hard and Soft: The Fed, 1965–2020.” Transcript of lecture to Markus’ Academy, Bendheim Center for Finance, Princeton University (via webcast), February 11.
Board of Governors of the Federal Reserve System. 2022a. “FOMC Projections materials, accessible version.” June 15.
Board of Governors of the Federal Reserve System. 2022b. “FOMC Projections materials, accessible version.” March 16.
Carvalho, Carlos, Andrea Ferrero, and Fernanda Nechio. 2017. “Demographic Transition and Low U.S. Interest Rates.” FRBSF Economic Letter 2017-27 (September 25).
Crump, Richard K., Stefano Eusepi, Marc Giannoni, and Ayşegül Şahin. 2019. “A Unified Approach to Measuring u*.” Brookings Papers on Economic Activity (Spring), pp. 143–238.
Cúrdia, Vasco, Han Chen, and Andrea Ferrero. 2012. “The Macroeconomic Effects of Large-Scale Asset Purchase Programs.” Economic Journal 122(564, November), pp. F289–F315.
Daly, Mary C. 2021a. “Lessons from History, Policy for Today.” FRBSF Economic Letter 2021-07 (March 4).
Daly, Mary C. 2021b. “Wage Dynamics: Theory, Data, and Policy.” Slides presented virtually at the National Bureau of Economic Research Spring 2021 Wage Dynamics in the 21st Century Conference. May 21.
Daly, Mary C. 2022. “This Time Is Different…Because We Are.” FRBSF Economic Letter 2022-05 (February 28).
Fernald, John, and Huiyu Li. 2019. “Is Slow Still the New Normal for GDP Growth?” FRBSF Economic Letter 2019-17 (June 24).
Friedman, Milton. 1961. “The Lag in Effect of Monetary Policy.” Journal of Political Economy 69(5, October), pp. 447–466.
Jordà, Òscar, Chitra Marti, Fernanda Nechio, and Eric Tallman. 2019a. “Inflation: Stress-Testing the Phillips Curve.” FRBSF Economic Letter 2019-05 (February 11).
Jordà, Òscar, Chitra Marti, Fernanda Nechio, and Eric Tallman. 2019b. “Why Is Inflation Low Globally?” FRBSF Economic Letter 2019-19 (July 15).
Lansing, Kevin J., Luiz E. Oliveira, and Adam Hale Shapiro. 2022. “Will Rising Rents Push Up Future Inflation?” FRBSF Economic Letter 2022-03 (February 14).
Peri, Giovanni, and Reem Zaiour. 2022. “Labor Shortages and the Immigration Shortfall.” Econofact (January 11).
Powell, Jerome. 2022. “Chair Powell’s Press Conference.” Preliminary transcript, June 15.
Rudebusch, Glenn D. 1995. “What Are the Lags in Monetary Policy?” FRBSF Weekly Letter 95-05 (February 3).
Shapiro, Adam Hale. 2020. “Monitoring the Inflationary Effects of COVID-19.” FRBSF Economic Letter 2020-24 (August 24).
Shapiro, Adam Hale. 2021. “What’s Behind the Recent Rise in Core Inflation?” SF Fed Blog (June 18).
Shapiro, Adam Hale. 2022. “How Much Do Supply and Demand Drive Inflation?” FRBSF Economic Letter 2022-15 (June 21).
Waller, Christopher J. 2022. “Responding to High Inflation, with Some Thoughts on a Soft Landing.” Speech at the Institute for Monetary and Financial Stability Distinguished Lecture, Goethe University Frankfurt, Germany, May 30.