In the U.S., we spent much of last year wondering whether the economy was in recession or simply pausing after years of extraordinary growth. In California, the recession picture was even less clear, with widespread weakness in the San Francisco Bay Area, but more stable conditions in the much larger Southern California economy.
Regional Report. The Regional Report appears on an occasional basis. It is prepared under the auspices of the Financial and Regional Analysis Section of the FRBSF’s Economic Research Department.
In the U.S., we spent much of last year wondering whether the economy was in recession or simply pausing after years of extraordinary growth. In California, the recession picture was even less clear, with widespread weakness in the San Francisco Bay Area, but more stable conditions in the much larger Southern California economy.
Doubts about the recession in the U.S. vanished in the wake of the September 11 terrorist attacks, as economic activity dropped sharply and economic uncertainty rose. More importantly, the September 11 attacks changed the profile of the recession, moving it from a confined and moderate downturn to a more significant and broad-based decline.
Although arguably the direct economic effects of the attacks were less pronounced in California than in many other areas of the nation, California was not immune from the fallout. Statewide employment losses accelerated significantly in the fourth quarter, spreading to most sectors of the economy. Moreover, the regional pattern of relative weakness was reinforced in the fourth quarter, with the post-September 11 effects most apparent in the San Francisco Bay Area.
This Economic Letter examines the changing profile of the recession in the U.S. and the economic contraction in California. The Letter points out that the first part of the recession was marked by significant retrenchment in business investment, especially for products produced in the high-technology sectors. In the post-September 11 stage of the recession, most of the acceleration in job losses can be traced to sectors directly affected by the decline in travel and tourism and to the paralyzing air of uncertainty affecting both consumers and businesses.
The U.S.—two faces of a recession
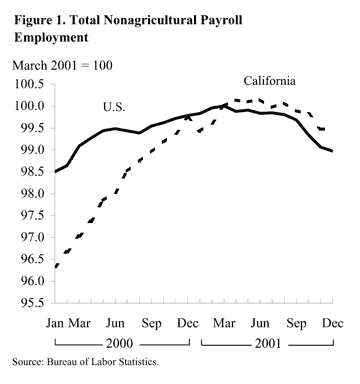
After much speculation about whether the U.S. economy was in recession, late last year a panel of economists under the auspices of the National Bureau of Economic Research announced that the economy had slipped into a recession after March of 2001. What appears to have clinched the decision on recession was the abrupt drop in economic activity following the terrorist attacks on September 11. Figure 1 shows the indexed value of the level of total nonagricultural payroll employment in the U.S., with March 2001, the official cyclical peak, equal to 100. As the figure shows, job losses were quite modest through the third quarter, but turned decidedly negative following the attacks. The sharp decline in employment in the fourth quarter, especially in October and November, ensured that the U.S. economy was in a recession. Overall, the U.S. shed 424,000 jobs during the second and third quarters combined, and 933,000 jobs in the fourth quarter.
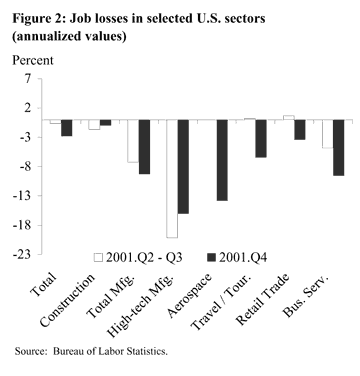
In addition to intensifying the U.S. contraction, the September 11 terrorist attacks altered its profile in terms of the mix of job losses. Figure 2 illustrates this by charting job losses in various categories for two periods: 2001:Q2-3 (unshaded bars) and 2001:Q4 (black bars). The categories “construction” and “manufacturing” are very broad groupings, with manufacturing including the narrower categories of high-tech and aerospace. The travel and tourism sector was constructed for this analysis and includes air transportation services, hotels, eating and drinking establishments, and local inter-urban travel. Eating and drinking establishments also are included in the standard retail trade category.
In 2001:Q2-3, weakness in the U.S. economy was evident mainly in business fixed investment, especially for information technology (IT) products and services. As a result, job losses were concentrated in manufacturing, particularly of high-tech goods, and in business services, including IT-related services.
In the fourth quarter, the recession profile shifted, with job losses spreading across a broad range of consumer- and travel-oriented sectors. For example, although the rate of job losses in total manufacturing was only slightly higher in the latter period than in the earlier period, the composition of the losses changed, as improved conditions in high-tech were offset by a sharp acceleration in job cuts in aerospace. Employment reductions in aerospace largely reflect weakness in commercial airline production and, at least in part, expectations of declining demand for commercial air travel brought on by the dramatic cutbacks in business and leisure travel following the terrorist attacks.
Outside of manufacturing, the higher rate of job losses also can be traced to sectors directly or indirectly affected by the events of September 11. During the fourth quarter, employers in the travel and tourism sectors shed jobs at an estimated 6.5% annual rate, for a net job loss of more than 225,000, with about one-half of those in the air transportation sector. The decline in travel and tourism jobs was equal to about one-fourth of the net drop in total payroll employment. Retail trade employment also declined during the fourth quarter as did employment in business services, with the two sectors combined experiencing an even larger number of lost jobs than travel and tourism (this holds even when accounting for the inclusion of eating and drinking establishments). The added weakness in both retail trade and business services can be attributed in part to businesses and consumers putting some spending decisions on hold in the aftermath of September 11. In the case of business services, for example, much of the acceleration in net job losses can be traced to a reduction in businesses’ use of temporary employees.
California—a tale of two regions
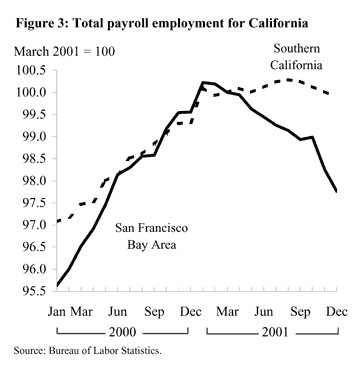
In the first part of 2001, growth in the California economy had decelerated considerably compared to the pace set in 2000. As Figure 1 showed, however, overall job growth held up better in the state than in the nation. Nevertheless, within the state, recession-like conditions were clearly evident in the San Francisco Bay Area even before they were in the U.S. Figure 3 shows that, from the start of the U.S. recession in March 2001 through September, the Bay Area lost jobs at more than a 2% annual rate. By comparison, jobs declined at a 0.6% percent annual pace in the U.S., and Southern California (includes Los Angeles-Long Beach, Orange County, San Diego, Riverside-San Bernardino, Santa Barbara-Santa Maria-Lompoc, and Ventura metropolitan areas) did not show sustained job losses until September of 2001.
The profile of the national recession in 2001:Q2-3—driven by declining business investment, especially in high-tech products—explains much of the difference in the economic performances of the Bay Area and Southern California during that period, given the Bay Area’s heavy dependence on IT sectors. IT accounts for about 14% of total nonagricultural employment and 32% of total payroll in the Bay Area, while it accounts for about 5.5% of total employment and 10% of total payroll in Southern California, about the same as the rest of the U.S. outside of California. In addition to being more exposed, the Bay Area experienced a faster pace of losses in high-tech manufacturing jobs in 2001:Q2-3 compared to Southern California (Figures 4 and 5).
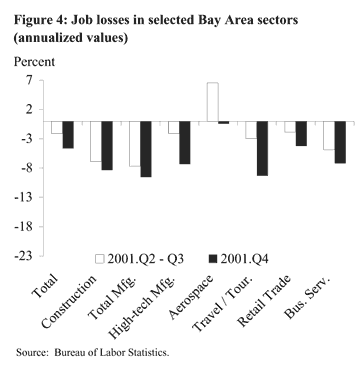
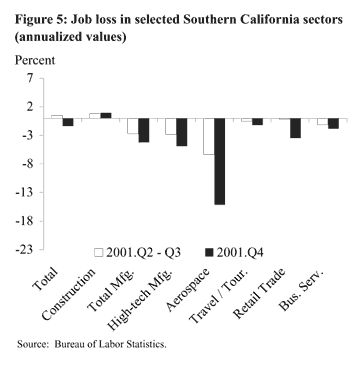
In the fourth quarter, job markets deteriorated in both the Bay Area and Southern California. In the Bay Area employers accelerated employment reductions, shedding jobs at a -4.7% annual rate during the fourth quarter. In Southern California, employers shifted from adding jobs in 2001:Q2-3 to cutting jobs at a -1.3% pace in 2001:Q4. As in the nation, both California regions experienced some acceleration in job losses in manufacturing, reflecting further weakness in the IT sectors as well as in aerospace; indeed, Southern California took a relatively big hit to jobs in aerospace, a sector in which that region has a higher exposure than does the Bay Area.
Somewhat surprising is the toll that the economic responses to September 11 appear to have taken on the Bay Area compared to Southern California. In terms of job and payroll shares, travel and tourism are of equal importance in the Bay Area and Southern California—about 6% of total employment and 5% of total payroll come from these sectors. However, a comparison of Figures 4 and 5 shows much larger percentage declines in the services sectors that likely were affected most adversely by the events on September 11. For example, in the Bay Area, fourth quarter job losses in travel and tourism averaged an estimated -9.3% at an annual rate—a net loss of about 7,700 jobs, or close to one-fifth of the net decline in total payroll employment. In Southern California, travel and tourism employment dropped at only an estimated -1.2% annual rate in the fourth quarter. For retail trade and business services, those sectors continued to do more poorly in the Bay Area than in Southern California, though on balance the additional weakness in the fourth quarter was not strikingly different in the two regions.
An array of factors could be contributing to the apparent differential impact of the events of September 11 on the travel and tourism in the Bay Area and Southern California. For example, business and leisure travel by air has been much more adversely affected than other forms of transportation, and travelers to the Bay Area are more likely to arrive by air than are those visiting Southern California. Regardless of the reason, the differential impact of September 11 on the travel and tourism sectors in the Bay Area succeeded in exacerbating the IT-driven growth differential that had evolved earlier in the year. The recent growth differential in favor of Southern California represents a reversal of roles for the two regions compared to most of the 1990s.
Mary Daly
Senior Economist
Fred Furlong
Vice President
Opinions expressed in FRBSF Economic Letter do not necessarily reflect the views of the management of the Federal Reserve Bank of San Francisco or of the Board of Governors of the Federal Reserve System. This publication is edited by Anita Todd and Karen Barnes. Permission to reprint portions of articles or whole articles must be obtained in writing. Please send editorial comments and requests for reprint permission to research.library@sf.frb.org