The long bear market in stocks has led to a nearly $1 trillion shrinkage in the value of private pension fund assets: at the peak in 1999, these assets were worth $4.63 trillion; in 2002, they were worth $3.69 trillion. In the case of “defined contribution” plans, the burden of these losses fell on the beneficiaries rather than on the sponsoring firms.
Financial Notes: This series supersedes Western Banking. It appears on an occasional basis and is prepared under the auspices of the Financial and Regional Research Section of the FRBSF’s Economic Research Department. Regional Banking Tables will continue to be updated online quarterly.
The long bear market in stocks has led to a nearly $1 trillion shrinkage in the value of private pension fund assets: at the peak in 1999, these assets were worth $4.63 trillion; in 2002, they were worth $3.69 trillion. In the case of “defined contribution” plans, the burden of these losses fell on the beneficiaries rather than on the sponsoring firms. In these plans, the employer provides an account for each participant and specifies only how contributions to each account are to be determined, not the amount of benefits the individual is to receive. Therefore, since the participant’s benefits depend solely on the amount of the contribution and the return earned on investing it, the employee bears all the investment risk.
In the case of “defined benefit” plans, in contrast, employers bear the investment risk, because the amount of the pension benefit is fixed according to a formula that usually involves such factors as the employee’s age, years of service, and compensation. Today, many firms sponsoring these plans now face a sizable gap between the value of their plan assets and the current value of their pension obligations. As a result, these firms must meet large re-funding requirements under the Employee Retirement Income Security Act (ERISA).
In this Economic Letter, I focus on the underfunding of defined benefit (DB) plans, whose assets account for about 43% of the $3.69 trillion total. In particular, I measure the underfunding in two ways and provide a simple simulation to give some perspective on how significant the re-funding requirements are likely to be.
Firms in the S&P 500 provide a good sample for analyzing the underfunding phenomenon—353 of those companies sponsor DB plans, and 327 have released their 2002 pension data so far. As of 2002, the total plan assets of those 327 firms stood at $917 billion, which was about 58% of all private DB plan assets. These firms are concentrated in a few sectors, such as the financial sector (e.g., Citigroup), the industrial sector (e.g., Boeing), and the consumer discretionary sector (e.g., General Motors). Many information technology companies in the S&P 500 do not offer DB plans to their employees; IBM and Hewlett Packard are two notable exceptions.

The funding status of a DB plan typically is measured in one of two ways. For this analysis, I use the economic definition, namely, the difference between the market value of plan assets and the projected benefit obligations (PBO) of the pension plan. The PBO, reported in a footnote of a sponsoring firm’s financial statements, represents the present value of all benefits attributed by the pension benefit formula to employee service rendered up to the financial statement date. It is measured using assumptions about future compensation levels if the pension benefit formula is based on compensation levels, like final-pay or final-average-pay. The PBO differs from the accumulated benefit obligations (ABO) used under ERISA to compute funding status. The ABO is based on employee service and compensation level prior to the financial statement date and does not account for expected future changes in compensation levels. Therefore, for plans with pay-related benefit formulas, PBO is always greater than ABO.
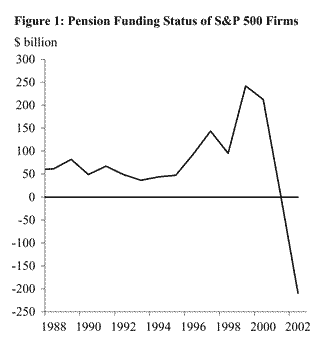
Figure 1 plots the aggregate net funding status for this sample. The runup in stock prices during the late 1990s pushed the aggregate overfunding to a record $242 billion in 1999, which led many companies either to reduce or stop making contributions to their pension plans, thus freeing up cash flow for other uses, including business investment.

Recent events have dealt the funding status of pension plans a double whammy. First, falling stock prices drove down the market value of plan assets. Second, lower interest rates raised the present value of PBO, because today’s value of future obligations is computed at a lower discount rate. As a result, many DB plans that had a large surplus just a couple of years ago now have a large deficit. At the end of 2002, 297 of the 327 plans were underfunded, and the total underfunding amount was $222 billion, about half of which was concentrated in the industrial sector and the consumer discretionary sector. Including the overfunding of a few plans, the aggregate net funding status for all 327 S&P 500 companies was at negative $210 billion.
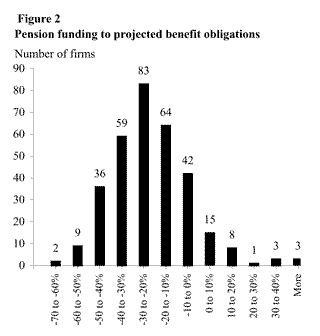
Figures 2 and 3 offer a couple of ways to get a perspective on the seriousness of the underfunding. Figure 2 shows the distribution of the funding status as a percent of PBO. In 2002, 42 plans were underfunded by less than 10% of PBO, 64 were underfunded by 10-20% of PBO, 83 were underfunded by 20-30% of PBO, and so on. Note that 11 pension plans were underfunded by over 50% of PBO.

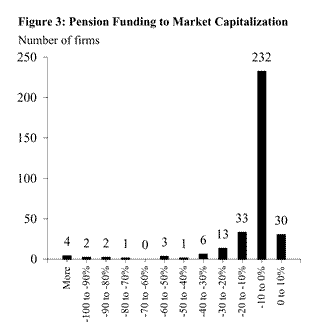
Figure 3 compares the funding status to the sponsoring firm’s economic value, that is, to its market capitalization. Although the vast majority of the underfunded plans, 232 out of 297, were underfunded by less than 10% of the sponsoring firm’s market cap, in four cases—Delta Airlines, Goodyear Tires, McDermott International, and General Motors—the funding gaps exceeded the firms’ 2002 market cap.
What will it take to close the gap?
ERISA, which mandates the funding requirements for DB plans, requires companies to make a normal contribution to their pension plan that is equal to the normal pension cost, called the Net Periodic Pension Cost (NPPC). The NPPC is expensed in a sponsoring firm’s income statement, and it includes changes in a firm’s pension obligations as a result of services rendered by employees. But in calculating the NPPC, those costs are netted against the firm’s expected return on plan assets. Note that the expected rate of return is determined by the sponsoring firm and could depart significantly from the plan assets’ realized return.
ERISA also requires additional contributions based on a plan’s funding status. In computing the funding status, ERISA compares the market value of plan assets to the ABO, which generally is less than the PBO. For a plan that is less than 90% funded, ERISA requires the sponsoring firm to make an additional contribution to the plan to reduce the funding deficiency within three to five years. There are exceptions, however. If a plan is over 80% funded today and was more than 90% funded for the past two years, the additional contribution requirement is waived. Furthermore, companies may request a hardship waiver or an extension period to meet the normal and additional contribution requirements.
Meeting these requirements could have a significant impact on a company’s cash flow and therefore on its capacity to invest and expand. In particular, to the extent that a sponsoring firm makes normal pension contributions on a regular basis, it is the additional contribution requirement triggered by the plan’s underfunding status that has the biggest marginal impact on a sponsoring firm’s cash flow.
A simple simulation can provide some perspective on the impact of the additional funding requirements. To begin, it is helpful to make some simplifying assumptions: (1) Assume firms with underfunded pension plans make five equal annual cash installments to the plan starting at the beginning of 2003 to bring the plan assets up to the PBO level at the end of 2007. (2) Assume PBO will grow at the historical average annual rate of 9% in the next five years. (3) Assume the rate of return on plan assets is 9%.
It is also helpful to note some caveats due to data limitations. First, although using the PBO to calculate underfunding is economically more appealing than using ABO, the additional funding requirement would be larger than the legal funding requirement under ERISA. Second, this simulation abstracts from funding requirement waivers. Thus, firms that qualify for the waivers have more time to make up the deficit. Third, because the current pension disclosure is for the consolidated company, it is not possible to separate out foreign pension plans that are subject to foreign pension regulations and not ERISA.
In the simulation, I compare the annual additional contribution to a sponsoring firm’s average annual capital expenditure between 1997 and 2001, implicitly assuming that firms trade off pension fund contributions with capital investment.

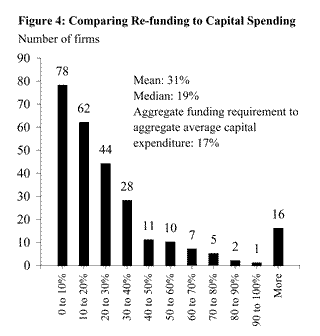
Figure 4 displays the additional funding requirement as a percent of average capital expenditure for 264 plans of nonfinancial companies that were underfunded as of 2002. The first left-hand bar indicates that 78 companies would find the additional pension fund contributions amount to less than 10% of their average capital expenditure. The second bar indicates that 62 companies would find the additional contributions amount to between 10-20% of average capital expenditure, and so on. The mean ratio of funding requirements to average capital expenditure is 31%, and the median is 19%. For these 264 firms, the aggregate additional funding requirement equals 17% of their aggregate average capital expenditure.
Notice that under these assumptions, a number of companies would find the additional contributions quite hefty compared to their capital investment. For example, summing up the last six bars on the right shows that 41 companies (or 15%) would face an additional contribution greater than one-half of average capital spending. The last bar shows that for 16 companies (or 6%) the additional contribution would exceed their historical average capital expenditure.
It is important to note that the actual re-funding profiles depend largely on the realized return on plan assets going forward. To the extent that some firms may qualify for the funding waiver in the near term, their re-funding requirements could be spread out over a longer period. Nevertheless, future pension re-funding represents a drag on sponsoring firms’ future cash flows. Also, for some firms with large pension underfunding, this problem has affected their bond ratings and, hence, borrowing costs.
The general decline in stock prices during the last three years drove many DB plans from record overfunding to substantial underfunding. Among firms in the S&P 500 that sponsor DB plans and for which we have data, 90% were underfunded, with total underfunding at $222 billion; the industrial sector and the consumer discretionary sector together accounted for almost one-half of the underfunding. The underfunding for the average firm does not seem large when compared to sponsoring firms’ projected pension obligations or to their market capitalization However, by either metric, a number of firms had pension underfunding that was quite sizable; this has weakened their financial positions and adversely affected their borrowing costs. For firms with underfunded pension plans, future funding requirements to close the deficit represent a drain on their cash flow. My simulation exercise reveals that for most firms, the size of future additional funding requirements is only a fraction of the size of capital spending. Nevertheless, a few firms would likely experience hefty funding requirements that could compete with their investment plans for scarce corporate resources.
Simon Kwan
Research Advisor
Opinions expressed in FRBSF Economic Letter do not necessarily reflect the views of the management of the Federal Reserve Bank of San Francisco or of the Board of Governors of the Federal Reserve System. This publication is edited by Anita Todd and Karen Barnes. Permission to reprint portions of articles or whole articles must be obtained in writing. Please send editorial comments and requests for reprint permission to research.library@sf.frb.org