At the beginning of the 1990s, policy doctors were almost unanimous in advocating a strong dose of capital and financial market liberation for developing countries as a way to improve their prospects for economic growth. The expectation was that such liberalization would make foreign saving available to local entrepreneurs, who would invest it in building the businesses, homes, and other infrastructure of their countries’ economies.
- Some background on measures of international capital mobility
- A new capital mobility measure
- Results
- Conclusion
At the beginning of the 1990s, policy doctors were almost unanimous in advocating a strong dose of capital and financial market liberation for developing countries as a way to improve their prospects for economic growth. The expectation was that such liberalization would make foreign saving available to local entrepreneurs, who would invest it in building the businesses, homes, and other infrastructure of their countries’ economies. And, indeed, waves of market-oriented liberalization swiftly followed.
By the end of the decade, however, financial liberalization had become the single most controversial policy prescription. Following the currency crises in East Asia and Russia, the debate shifted from when to liberalize the capital account to whether to liberalize it at all. For example, Rodrik (1998) argues that there is no evidence in the data that countries without capital controls have grown faster, invested more, or experienced lower inflation.
This Economic Letter gives a summary of another analysis of the impact of financial liberalization on the economic performance of developing countries from 1991 to 2001. It describes a new and simple method that measures the degree of international capital mobility and that also provides useful information about the degree to which a nation’s domestic stock of capital is self-financed.
Some background on measures of international capital mobility
The seminal paper of Feldstein and Horioka (1980) focused on the correlation between domestic saving and investment as a measure of capital mobility. In an internationally integrated financial market, this correlation should be low, as capital would move freely across borders to take advantage of investment opportunities. However, the authors found high correlations, even among advanced industrial countries, suggesting that financial markets fell far short of complete international financial integration.
Their work sparked voluminous research. Some concluded that financial markets have become more integrated in recent decades, suggesting that international financial integration has been increasing over time. Others concluded that such correlations do not provide enough information to ascertain the true degree of integration of financial markets—for example, high correlations may occur even with full financial integration, because shocks may induce saving and investment to move in the same direction (see Obstfeld and Rogoff 1999 for a review).
A new capital mobility measure
Aizenman et al. (2004) address issues similar to those of Feldstein and Horioka (1980). Their methodology, however, differs, in that it focuses on the ratio of cumulative discounted gross national saving and gross national investment. They interpret this as a “self-financing ratio,” indicating the share of tangible capital supported by past national saving. The numerator may be viewed as the amount of capital that would be available if all of the country’s investments were domestically financed—that is, without relying on external borrowing, and assuming that the path of national savings was unchanged. The denominator of the ratio represents the actual stock of domestic capital.
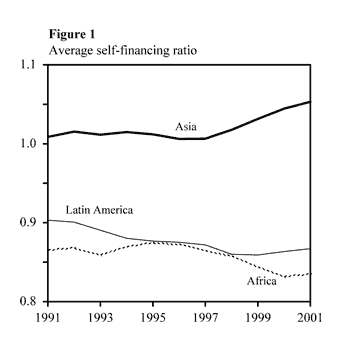
Under ideal circumstances, a self-financing ratio that is equal to one would correspond to an economy where the entire stock of domestic capital is self-financed, while a ratio below one indicates reliance on external borrowing and foreign saving. Alternatively, one minus the self-financing ratio would represent the “foreign-financing” ratio, or the fraction of a nation’s domestic capital that was financed by external borrowing.
This approach also differs from those that calculate the external wealth of nations (such as Lane and Milesi-Ferretti 2001), which rely on current market prices of assets and liabilities to evaluate the net assets and characterize the portfolios of a country. Because the self-financing ratio aggregates past gross domestic saving and investment to identify the degree to which the stock of capital has been self-financed, it is more robust than those measures to valuation changes, such as real exchange rate shocks, stock market changes, or partial defaults.
The self-financing ratio methodology does have its limitations, however. First, the quality of the self-financing ratios is limited by the quality and availability of the data and by the accuracy of the assumptions about the various parameters. Second, the same skepticism in the literature about the interpretation of the Feldstein and Horioka correlations applies to this methodology as well, as it does not attempt to model the forces leading to the observed financing ratios. Nevertheless, sharp changes in self-financing ratios, or the absence of such changes, may still provide useful diagnostic information about changes in international financial integration.
The self-financing ratios reveal a number of interesting patterns. First, there is no evidence of a significant change in the pattern of financing ratios of developing countries in the period 1991 to 2001, suggesting little structural change in the degree of international financial integration. This result is consistent with the notion that, although financial integration has increased, it has only facilitated greater diversification of assets and liabilities—for example, inflows of foreign saving have often been financing outflows of domestic saving—resulting in little net impact on financing ratios. One caveat to this interpretation, however, is that the analysis takes place at a high level of aggregation, so the finding of relatively stable self-financing ratios also is consistent with significant changes in the decomposition of capital flows (like changing maturity and currency mismatches, etc.).

Second, the average self-financing ratio for developing countries was found to be about 90%. Moreover, this ratio remained stable throughout the 1990s despite the wave of financial liberalization in the early part of the decade. There are, however, significant differences not only from country to country but also from region to region. For example, Figure 1 displays the average self-financing ratios for countries in three regions: Latin America, Asia, and Africa. In Latin America and Africa, the self-financing ratios fell by about 3%, indicating that they have increased their reliance on foreign saving as a means of financing their tangible capital. In Asia, however, the ratio rose, and most of the increase occurs after the 1997-1998 East Asian crisis; this suggests that, as a region, Asia has financed its rapid accumulation of capital domestically and that the 1997-1998 crisis led to a significant surge in precautionary saving.
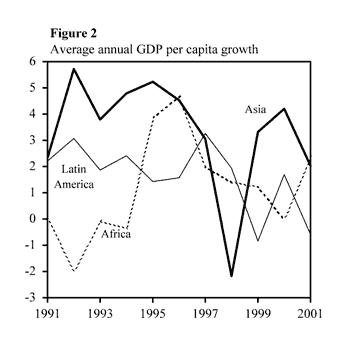
Third, there is no evidence of a “growth bonus” associated with increasing the financing share of foreign saving. Indeed, the evidence suggests just the opposite: throughout the 1990s, countries and regions with higher self-financing ratios grew significantly faster than countries and regions with low self-financing ratios. (See Figure 2, which displays average annual per capita GDP growth across the countries in Latin America, Asia, and Africa). Yet, the results rule out neither the possibility that financial liberalization may affect the “quality of growth,” as measured by total factor productivity nor the possibility that domestic investors possess superior information about domestic investment opportunities.

Finally, in a cross-country GDP per capita growth regression, we found a positive and economically significant effect of self-financing ratios on real per capita GDP growth. Notably, the correlation between the change in de facto financial openness between the1980s and 1990s and the change in the self-financing ratio between 1991 and 2001 is close to zero. This reflected the fact that increases in financial openness over this period were substantial, (average and median increases in financial openness were 65%, and 30%, respectively), while self-financing rates remained roughly constant. We also applied our methodology to a panel/cross-sectional time-series during 1970-2000. This panel yields results supportive of the main hypothesis: a higher self-financing rate has been associated with higher growth during 1970-2000.
Self-financing ratios provide a new method for evaluating the net sources for financing the domestic stock of capital. Aizenman et al. (2004) illustrate the usefulness of this method by evaluating the patterns of capital stock financing of developing countries in the 1990s. The results indicate that the period was, indeed, characterized by a rapid increase in gross capital flows, but that self-financing ratios in developing countries remained stable. This approach does not permit an inference about direct causality—that is, the analysis does not imply that policies aimed at increasing self-financing ratios would lead to faster growth or to welfare improvements. Rather, all that can be inferred is that, despite greater financial integration, foreign savings, on average, have not been a viable source of financing developing countries’ domestic capital. The main benefit would seem to be greater financial diversification.
Joshua Aizenman
University of California, Santa Cruz and the NBER
Visiting Scholar, FRBSF
References
Aizenman, J., B. Pinto, and A. Radziwill. 2004. “Sources for Financing Domestic Capital: Is Foreign Saving a Viable Option for Developing Countries?” NBER Working paper #10624.
Feldstein, M., and C. Horioka. 1980. “Domestic Saving and International Capital Flows.” The Economic Journal, pp. 314-329.
Lane, P., and G. Milesi-Ferretti. 2001. “The External Wealth of Nations: Measures of Foreign Assets and Liabilities for Industrial and Developing Countries.” Journal of International Economics 55(2), pp. 263-294.
Obstfeld, M., and K. Rogoff. 1999. International Macroeconomics. Cambridge: MIT Press.
Rodrik, D. 1998. “Who Needs Capital-Account Convertibility?” In Should the IMF Pursue Capital Account Convertibility? Essays in International Finance no. 207, Department of Economics, Princeton University.
Opinions expressed in FRBSF Economic Letter do not necessarily reflect the views of the management of the Federal Reserve Bank of San Francisco or of the Board of Governors of the Federal Reserve System. This publication is edited by Anita Todd and Karen Barnes. Permission to reprint portions of articles or whole articles must be obtained in writing. Please send editorial comments and requests for reprint permission to research.library@sf.frb.org