Fifteen years ago, like today, there were concerns that house prices might collapse. One big difference between then and now, however, is the basis for those concerns.
- A simple model of the housing market
- Demand-side factors and expectations
- How elastic is supply?
- Conclusion
- References
Fifteen years ago, like today, there were concerns that house prices might collapse. One big difference between then and now, however, is the basis for those concerns. Today, people are worried that a house price bubble (if one exists) might burst, while 15 years ago, people were worried about demographic effects, specifically, the inevitable aging of the baby boomers.
The earlier concern was sparked by a paper by Mankiw and Weil (1989), in which the authors famously predicted that between 1987 and 2007, real house prices could fall by 3% per year. In fact, real house prices grew by an average of 3-1/2% per year from 1987 to 2004. Of course, the Mankiw-Weil prediction may yet come to pass; or it may have already occurred and simply been masked by the surge in demand over the last seven years that is due to other factors. But the relationship between demographics and house prices remains interesting both because housing constitutes such a large component of the typical household’s wealth, and because much remains to be understood about the consequences of the baby boomers liquidating their housing and financial assets. In this Economic Letter, I revisit the economics of the housing market and demographics.
A simple model of the housing market
Prices and quantities in housing markets are determined by the interaction of the construction sector (the supply side) with households (the demand side). Key variables governing the supply of new housing include prices, the costs of construction materials and land, the cost of financing, and the amount of undepreciated housing stock. Similarly, key variables governing the quantity of housing include prices, the level of mortgage rates, expectations of permanent income or wealth, rates of return on other investments, and demographic factors that influence the decision to buy a house.


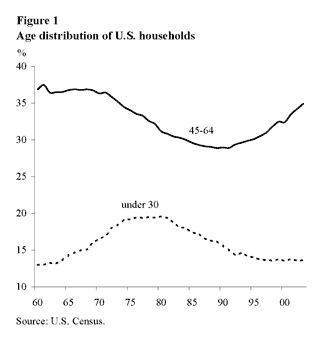
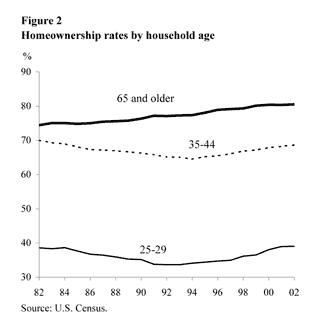
One demographic factor that is particularly significant is the age distribution. A baby boom, or a temporary increase in the birth rate, shifts the age distribution (Figure 1). This is important because, as Figure 2 shows, homeownership rates vary considerably by age, increasing from an average of less than 40% for households in their twenties to almost 70% by the time they reach ages 35-44. Evidently, the initial decision to buy a house is closely related to life-cycle events, such as having a family. Importantly, homeownership rates for households 65 and older are even higher; apparently, they are reluctant to leave homeownership, even as their household size shrinks and the need for space declines.
The effects of the postwar baby boom on the age distribution of the U.S. population suggest that the share of younger households will rise over time. If ownership rates follow historical patterns, this larger share of young households will lead to a decline in the demand for housing and downward pressure on prices. To assess the timing and magnitude of this downward pressure, it is useful to consider two extreme cases. In the first case, households and builders are forward-looking, and demand and supply are “price-elastic,” meaning quantities are responsive to changes in prices. In this market, in anticipation of weaker demand for housing as boomers age and exit, prices would tend to decline, because young households would be unwilling to pay high prices now for houses that will be cheaper in the future. However, this does not imply that house prices would collapse. With lower prices, price-elastic households may decide the time is ripe to invest more in housing—either a bigger house or a second house. In addition, builders would observe the lower prices and reduce new construction. So, in this market, the effect of the exiting baby boomers on house prices would be gradual, and the overall magnitude of price changes would not be great.
At the other end of the spectrum is a housing market with myopic participants whose behavior is not responsive to price changes. Even though relatively large numbers of baby boomer houses are expected to be for sale in the future, myopic households would not “see” this and would not force prices down. Builders would keep building straight into the downturn in demand. Once boomers actually start to exit, there would be relatively more houses for sale, and households would require large discounts in order to increase their consumption. In this market, house prices would be much more volatile, and the overall magnitude of price changes would be great. The question, then, is: Which of these two extremes comes closer to describing the U.S. housing market today?
Demand-side factors and expectations
As Figure 2 showed, despite significant variation in house prices and interest rates over time, homeownership rates by age of household are not very different now from any time in the last 25 years. This is consistent with other research suggesting that, compared with the demand for other consumer goods, housing demand is relatively price-inelastic. Such a finding is not surprising, because housing is special in a couple of ways. First, like food, it is a basic need, and all households consume it in some fashion. Second, housing comes in hard-to-break-up packages; therefore, while households may be expected to buy more house if prices decline, they are less likely to buy more houses.
So will demand for the houses of exiting baby boomers be weak? If the houses come onto the market suddenly, then prices are bound to fall. This is the essence of demand inelasticity. For example, rural areas and cities that have suffered population loss have not enjoyed the large increases in house prices that the rest of the nation has recently experienced but saw price declines instead.
But the aging of a baby boom need not imply population loss. In fact, the U.S. population is projected to grow over the next 50 years, though the average household age will decline. Therefore, apart from the issue of homeownership rates, there should be enough potential demand to meet the supply of baby boomer houses for sale, thus providing some support for prices.
There is also a question of how imminent a sale of baby boomer assets is. While homeownership rates stay high as households age, there is a debate on whether real housing expenditures decline with age. This was a prominent assumption in the Mankiw and Weil analysis that has not been fully resolved. On the one hand, baby boomers have more financial assets and generally better health than their parents, which would tend to support housing consumption. On the other hand, changes in the tax code now make it easier to trade down, which reduces housing consumption. This debate, however, matters only for the timing of the baby boomer impact. At some point, death or illness will cause baby boomers’ houses to come onto the market.
It would appear, then, that the most important question as far as demand is concerned is how “expected” the sale of baby boomer housing assets will be. Unfortunately, the empirical literature on house prices provides conflicting evidence on this question. House prices tend to appreciate over long periods of time, and then flatten out over long periods of time. Therefore, in general, one can form reliable expectations of future price appreciation by extrapolating from the recent past. At the same time, for extreme events, there is evidence that market prices adjust before the events actually take place; for example, real estate values tend to fall immediately upon the announcement of plans to close a local military base. Furthermore, Krainer and Wei (2004) show that the volatility of house prices, though perhaps excessive, is essentially pinned down by volatility in future prices and rents, as asset pricing theory would suggest.
The analysis in Mankiw and Weil assumed a very inelastic supply response—for every 1% increase in house price the construction sector would increase the stock of housing by 1%. Other researchers (e.g., Topel and Rosen 1988) estimate the supply response to be more elastic—for every 1% increase in house price, new construction increases by 1.5-3%.
During the 1990s, however, the link between house prices and new residential construction shifted dramatically. Even though house prices shot up at the end of the decade, the response from the construction sector was unusually subdued. At first blush, this suggests that supply has become less price elastic. But there is good reason to think the supply response reflects developments particular to that period. A well-established literature in urban economics on supply constraints, such as regulation and physical geography, shows how these constraints affect price dynamics. Glaeser, Gyourko, and Saks (2004) argue that these constraints have become more binding, particularly in markets that experienced productivity shocks over the past 20 years. While this may partly explain why prices have risen so quickly in certain regions without a matching supply response, it is unlikely to imply that developers would ignore falling prices and rising vacancies and keep on building. Additionally, the subdued supply response during the recent upswing in prices has apparently not led to overbuilding, implying less likelihood of excess supply once the baby boomers leave their houses.
Even as discussion of the current run-up in house prices points to the extremely favorable demographic conditions for demand, little has been said (lately) about what will happen once these demand conditions ebb. The worst-case scenario for house price declines depends on three factors: an inelastic demand for housing, a fair degree of myopia when forming expectations, and an inelastic supply function. However, recent research in urban economics suggests that two of these factors—expectations formation and the supply response—are probably more flexible than once thought. Furthermore, a negative demand shock like the aging and exiting of baby boomers is only one of many factors to consider in anticipating the future of house prices. The productivity gains in the 1990s can be viewed as a positive demand shock. To the extent that younger generations now expect higher permanent income, this increase in expected wealth should help support house prices.
John Krainer
Economist
Glaeser, E., J. Gyourko, and R. Saks. 2004. “Why Have House Prices Gone Up?” Harvard University working paper.
Krainer, J., and C. Wei. 2004. “House Prices and Fundamental Value.” FRBSF Economic Letter. .
Mankiw, N.G., and D. Weil. 1989. “The Baby Boom, the Baby Bust, and the Housing Market.” Regional Science and Urban Economics 19, pp. 235-258.
Topel, R., and S. Rosen. 1988. “Housing Investment in the United States.” Journal of Political Economy 96(4) pp. 718-740.
Opinions expressed in FRBSF Economic Letter do not necessarily reflect the views of the management of the Federal Reserve Bank of San Francisco or of the Board of Governors of the Federal Reserve System. This publication is edited by Anita Todd and Karen Barnes. Permission to reprint portions of articles or whole articles must be obtained in writing. Please send editorial comments and requests for reprint permission to research.library@sf.frb.org