The price of oil has risen by about 60% since mid-2004 and by more than 40% since the beginning of 2005. Though the U.S. economy has apparently absorbed this supply shock well so far, the path of future oil prices remains a concern for monetary policymakers.
- Oil futures prices and spot oil prices
- Forecasting models and methodology
- Results
- Predictions
- Conclusion
- References
The price of oil has risen by about 60% since mid-2004 and by more than 40% since the beginning of 2005. Though the U.S. economy has apparently absorbed this supply shock well so far, the path of future oil prices remains a concern for monetary policymakers. Higher oil prices can damp demand, as consumers and firms spend more of their budgets on oil-related products and less on other goods and services. Furthermore, if higher oil prices are passed through to a significant extent to other goods and services and ultimately wages, inflationary pressures can build.
Is the price of oil likely to rise further, or will it decline gradually, as it did in the mid-1980s? A natural place to look for an answer is in the markets, where oil traders are knowledgeable about the industry and where their profits ride on making sound investments. This Economic Letter discusses how to forecast future oil price movements based on information from both the oil futures market and the spot market. In particular, we conduct a series of forecasting exercises and compare the performance of models that use oil futures and spot prices in an attempt to find the one that performs best.
Oil futures prices and spot oil prices
Oil futures prices reflect the price that both the buyer and the seller agree will be the price of oil upon delivery. Therefore, these prices provide direct information about investor’s expectations about the future price of oil.
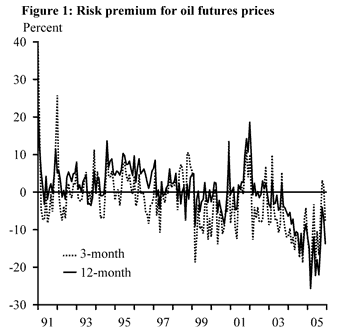
 Like the prices of every other risky asset, however, oil futures prices include risk premiums, to reflect the possibility that spot prices at the time of delivery may be higher or lower than the contracted price. Figure 1 plots a measure of the risk premium for oil futures prices, defined as the difference between the oil futures price and the expected future spot price from the Consensus Forecast’s survey. The difference is expressed as a percentage of the current spot price. As the figure reveals, although the oil price risk premiums are close to zero on average, they are quite large and volatile over time. This suggests that oil futures prices are not necessarily the best predictor of future oil prices.
The current, or spot, oil price may also help predict future oil price movements. As Hotelling (1931) states, given certain simplifying assumptions, the opportunity cost of storing oil is the foregone interest rate. Therefore, in theory, the expected rate of return to holding oil should be identical to the interest rate; in other words, the price of oil is expected to appreciate at the interest rate. In practice, however, holding oil stocks often provides some advantages or flexibilities for manufacturers in managing their operational risks. Such benefits (net of storage costs) are called “convenience yields” and should be reflected as a premium, mostly positive, in the current oil price. Thus the expected rate of return of oil stocks may not be identical to the interest rate, and a forecast based on the current spot price may tend to overpredict future oil prices.
Forecasting models and methodology
We formulate four models based on oil futures prices and the spot oil price. The first is a random walk model, which predicts that spot oil prices will stay at their current levels. This is the simplest statistical model and provides a benchmark to evaluate the forecasting performance of other models. Second is Hotelling’s model, which predicts that the future oil price will be the current spot price adjusted for the interest rate. Third is a futures model, which predicts an oil price level in the future identical to the current futures price level. Fourth is a futures-spot spread model, which uses the spread between the current futures prices and the spot price to predict movements in the future price of oil.
We evaluated model performance using two criteria. First, we estimated the model over the full sample (mid-1980s to present), calculated its forecasts for horizons that vary from one to twenty-four months and then compared the forecasts with the actual oil prices over these months. The model with the smallest average prediction errors is said to have the best “in-sample” fit, since its parameters are estimated over the full sample.
Second, we conducted a more realistic “out-of-sample” forecasting exercise, where we estimate the model using the data up to a given month, instead of the full sample, and then make forecasts for future months. The model with the smallest “out-of-sample” forecast errors has the most forecasting power, because, in practice, we are only able to observe data up until today (that is, we are only able to perform “out-of-sample” forecasts). However, we use both criteria in evaluating the models to obtain more robust conclusions.
Several conclusions emerge from the forecasting exercises. Raw futures prices are found to be unbiased predictors of future oil prices; that is, for the past two decades, the raw oil futures prices are as likely to overpredict as to underpredict future oil prices. However, while the average of forecasting errors based on raw futures prices may be close to zero, such errors are quite large over time. Indeed, raw oil futures prices provide relatively less accurate forecasts than models using both the futures prices and spot price (the “futures-spot spread” model). Therefore, incorporating information on the relationship between current futures prices and spot price improves the forecast.
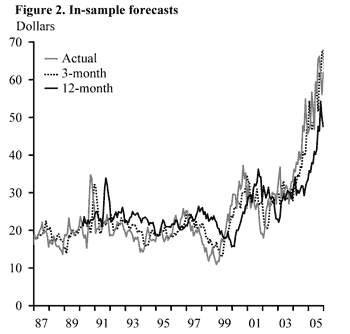
 The “futures-spot spread” model has the best “in-sample” fit. Figure 2 displays the fitted value for three-month and twelve-month horizons and the actual oil prices. The standard deviations of the prediction errors range from about 10% of the spot price at a one-month horizon to about 30% at a twelve-month horizon. The next best performer is the Hotelling model (based on the current spot price and interest rate), with the standard deviations of prediction errors ranging from about 10% at a one-month horizon to about 35% at a twelve-month horizon.
The “futures-spot spread” model also does a fairly good job when predicting “out-of-sample.” In particular, it performs better than the others when predicting oil price movement in the near term, up to the next four months. For longer horizons, Hotelling’s model performs slightly better. The performance of raw futures prices is only slightly worse than that of the “futures-spot spread” model at short horizons but much worse at longer horizons. We also conducted the forecasting experiment for different periods and found that, during the past two decades, relative performance of these models was quite stable.
The observation that futures prices are more useful in forecasting near-term oil price movements may reflect the fact that the near-term oil futures markets are much more liquid than longer-term futures markets. For instance, the average daily trading volume of the “light, sweet crude oil” futures contracts on the New York Mercantile Exchange over the past two years is about 72,600 contracts for a horizon of one month, 22,000 units for two months, 4,800 for four months, and only 1,000 units for the one-year horizon (one unit represents 1,000 barrels). As the futures market becomes less liquid at longer horizons, the quoted futures prices may become a less accurate measure of expected oil prices, because they are more vulnerable to shocks that may not be related to the expected oil price movements in the future.
On the basis of the estimated relationship between the oil futures prices and future changes in spot prices, forecasts of crude oil prices for the next two years can be calculated from the latest spot and futures prices. On December 12, 2005, the spot price for West Texas crude oil was about $62. The three-month and twelve-month futures prices were both around $64.
Based on these data, the “futures-spot spread” model projects a slight increase in oil prices, with the spot price rising to $65 per barrel by March 2006 and $67 per barrel by December 2006. However, the accuracy of such forecasts is quite low. For instance, we can only say that, with 90% certainty, the spot price in March 2006 will be between $55 and $74 per barrel.
Conclusion
Oil futures prices contain important information about future oil price movements, especially for the near term. In particular, taking into account the relationship between current spot and futures prices instead of considering only the raw futures price can significantly improve forecasting accuracy. Prediction errors, however, are still substantial, and accurately predicting the future price of oil seems as elusive as ever.
Tao Wu
Economist
Andrew McCallum
Research Associate
References
Consensus Forecasts Inc. 2005. “September 2005 Oil Prices.” Consensus Forecasts (September 12) p. 27.
Hotelling, Harold. 1931. “The Economics of Exhaustible Resources.” The Journal of Political Economy 39(2) (April) pp. 137-175.
Opinions expressed in FRBSF Economic Letter do not necessarily reflect the views of the management of the Federal Reserve Bank of San Francisco or of the Board of Governors of the Federal Reserve System. This publication is edited by Anita Todd and Karen Barnes. Permission to reprint portions of articles or whole articles must be obtained in writing. Please send editorial comments and requests for reprint permission to research.library@sf.frb.org