A familiar old saw about the conduct of monetary policy is that it’s like trying to drive a car while looking only in the rearview mirror. The idea is that policymakers are trying to steer a course that will keep the economy close to full employment with low, stable inflation, while their only knowledge of the road ahead is based on data about the past.
- How the national accounts are produced and revised
- The July 2005 annual revision
- Implications for policy in 2004
- Conclusions
- References
A familiar old saw about the conduct of monetary policy is that it’s like trying to drive a car while looking only in the rearview mirror. The idea is that policymakers are trying to steer a course that will keep the economy close to full employment with low, stable inflation, while their only knowledge of the road ahead is based on data about the past.
As if this situation weren’t challenging enough, the rearview mirror sometimes gives a distorted reflection, in the sense that the data policymakers see at any one point in time are often later revised. This Economic Letter discusses a particular example, the annual revision to the national accounts in July 2005, which included a substantial upward revision to previously benign inflation estimates, and it lays out some ways that policymakers can address the challenge of changing data.
How the national accounts are produced and revised
The Bureau of Economic Analysis (BEA) produces the national income and product accounts which include, among other things, quarterly estimates of GDP and monthly estimates of price indexes for personal consumption expenditures (PCE). Although the PCE price index is conceptually similar to the more widely known inflation measure, the consumer price index (CPI), it differs in a number of technical details. One difference is scope—the PCE index is a bit broader than the CPI, in part because it includes more items whose prices are not observable and therefore must be imputed. Another difference is in the formulae—the PCE index uses so-called chain-weights, which economists tend to prefer because the weights are updated regularly to reflect actual spending patterns. Several Federal Reserve policymakers have indicated that they believe the PCE index is a better gauge of inflationary pressures, and typically they prefer the “core” measure, which excludes the volatile food and energy components (see, for example, Yellen 2005).
In establishing a schedule of data releases, the BEA can face some tension between timeliness and accuracy. Often the initial releases are based on highly incomplete or even nonexistent source data; later releases incorporate more complete source data, some of which (for example, tax data and many surveys) are available only annually or even less often. Hence, over time, the BEA may revise earlier estimates to incorporate new source data and improved methodologies. (See BEA 2004 for a discussion of methodology and data sources.)
Some revisions are larger than others. The most important are the annual revisions each July, when the BEA revises the most recent three years of national income and product data, and the so-called comprehensive or benchmark revisions, which occur about every five years and which may involve more major changes, for example, in definitions, classifications, or presentation.


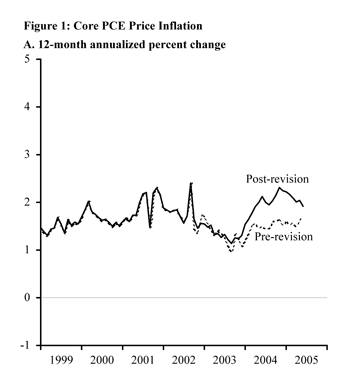
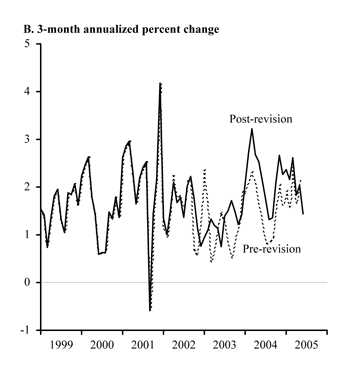
In the July 2005 annual revision, the BEA revised its estimates of inflation and GDP for the period 2002-2004. Most notably, the growth rate of core PCE price inflation for 2004 was revised upward by about 0.6 percentage point from a rate of 1.6% to 2.2% (measured from the fourth quarter of 2003 through the fourth quarter of 2004). There were also much smaller revisions for 2002 and 2003. Panel A of Figure 1 plots the 12-month change in core PCE price inflation, both before and after the annual revision. Panel B plots the 3-month change, which shows that, despite the large upward revision to recent history, inflation in the second quarter of 2005 had receded somewhat from its earlier peaks.
The bulk of the revisions to core PCE inflation occurred in its so-called nonmarket component. The market component (accounting for four-fifths of all consumer expenditure) covers items for which there are observable transactions prices, such as purchasing milk at a grocery store. The nonmarket component consists of items for which there are no observable transactions prices.
A good example of a nonmarket component is a financial service that commercial banks provide consumers, such as access to an ATM network. Bank depositors often do not pay direct fees for a service like this, so there is no observable transaction price. Instead, depositors pay for such services by accepting a lower return on their deposits. Banks can then use the funds deposited to buy interest-bearing securities or to make loans—thereby earning income to cover their costs of providing services to depositors. For each dollar of deposits, the BEA in essence counts the margin between a “reference” (relatively risk-free) interest rate and the rate paid to depositors as the nominal output of the bank. The BEA uses activity measures, such as ATM transactions and checks written, to measure real output. Finally, the ratio of nominal to real output measures the imputed price.
The majority of the July 2005 revisions in the nonmarket component occurred in two categories: “services furnished without payment by financial intermediaries except life insurance carriers” and “medical care and hospitalization insurance.” The major contribution to the first category, which accounted for about 1.6% of core PCE, took place in the category “other financial institutions,” which includes, for example, mutual funds. Mutual fund expenditure, in nominal terms, basically involves administrative expenses, such as researching investments and managing accounts. The BEA measures real mutual fund output mainly by the transactions that the funds undertake; the price deflator is then the ratio of nominal expenditure to the index of real transactions. Its deflator was revised up about 14 percentage points and, as a result, this category contributed about 0.23 percentage point to the upward revision in core PCE inflation.
The second category, medical insurance, basically involves the administrative costs paid by insurance companies. This is part of what people pay to consume medical services, but there are no directly observable market prices for these services. Instead, the BEA imputes a price for this category. Medical insurance accounted for about 1.5% of core PCE in 2004. Its deflator grew by about 9 percentage points faster over 2004 (Q4/Q4) than previously announced, leading to a 0.14 percentage point increase to the revision in core PCE inflation.
In both cases, the revisions reflected newly available source data that indicated that the preliminary BEA estimates were inaccurate. We note that both financial and medical services raise considerable conceptual and practical difficulties. Basu, Fernald, and Wang (2004), for example, discuss some of the conceptual difficulties with financial-service measurement; for services more generally, it is difficult to measure quality change over time. Nevertheless, these difficulties are long-standing, and the revised data presumably are more comparable with data for other time periods and presumably give a more accurate read on where the economy has been.
Implications for policy in 2004
When the Federal Open Market Committee met in May 2004, the BEA’s best estimate of core PCE inflation was around 1-1/2%. The statement released after the meeting justified a “measured” pace of adjustments to monetary policy by noting that inflation was low: “…at this juncture, with inflation low and resource use slack, the Committee believes that policy accommodation can be removed at a pace that is likely to be measured.”
The revised figures indicate that core PCE inflation was nearly 2-3/4% in the first quarter of 2004. How might the revised information have changed the course of policy? One way to answer this question is to invoke the Taylor rule. The FOMC does not set policy according to this rule, but the Taylor rule has served as a popular rule-of-thumb for how the Federal Reserve might set its target for the federal funds rate. The rule specifies that the Federal Reserve’s target for the federal funds rate depends on (1) an “inflation gap” that reflects the difference between actual inflation and the Federal Reserve’s long-run objective, (2) an “output gap” that reflects how far economic activity is above or below its “full employment” level, and (3) a “neutral rate” that reflects the level of the short-term nominal interest rate that would be consistent with full employment and inflation at its objective.
Normally, the Taylor rule is specified in terms of overall inflation, not core inflation. Conceptually, however, since core inflation was running higher than the Committee thought, this suggests that there was a larger positive “inflation gap” than the Committee perceived. The Taylor rule recommends responding to inflation more than one-for-one. Hence, other things equal, given that inflation was running higher than originally thought, it would have recommended a substantially higher setting for the federal funds rate.
Yogi Berra once said, “It’s hard to make predictions, especially about the future.” But it’s also hard to predict how our views of the past will change as statistical agencies get new data and incorporate them into their estimates. This Economic Letter focused on the recent revisions to inflation figures, which suggest that inflation had been running higher than previously reported. Such uncertainty about the current state of the economy complicates policymaking.
How can policymakers mitigate the problems caused by inherently imperfect data? In assessing underlying inflationary trends, policymakers can look at a broader range of inflation indicators as well as at empirical relationships that might help predict inflation. This is the case even if policymakers care about an inflation gap defined narrowly in terms of core PCE inflation.
The problem of data uncertainty is, of course, not limited to inflation. Policymakers also need—but do not necessarily have—timely and accurate measures of the output gap (see, for example, Rudebusch, 2001, and Orphanides and Van Norden, 2002) or the neutral rate of interest (see Laubach and Williams, 2003, and Wu, 2005), two other key components for implementing a Taylor-type rule. These concerns again suggest looking broadly at indicators of the economy, in line with Greenspan’s (2005) recommendation that policymakers seek to interpret “the full range of economic and financial data.”
John Fernald
Vice President
Stephanie Wang
Research Associate
References
[URLs accessed December 2005.]
Basu, Susanto, John Fernald, and Christina Wang. 2004. “A General-equilibrium Asset-pricing Approach to the Measurement of Nominal and Real Bank Output.” FRB Boston Working Paper 04-7.
Bureau of Economic Analysis. 2004. “Updated Summary NIPA Methodologies.”
Greenspan, Alan. 2005. “Reflections on Central Banking.” Remarks at a symposium sponsored by the Federal Reserve Bank of Kansas City, Jackson Hole, Wyoming, August 26.
Laubach, Thomas, and John C. Williams. 2003. “Measuring the Natural Rate of Interest.” Review of Economics and Statistics 85(4), pp. 1063-1070.
http://www.federalreserve.gov/pubs/feds/2001/200156/200156abs.html
Orphanides, Athanasios, and Simon Van Norden. 2002. “The Unreliability of Output-Gap Estimates in Real Time.” Review of Economics and Statistics 84(4), pp. 569-583.
Rudebusch, Glenn. 2001. “Is the Fed Too Timid? Monetary Policy in an Uncertain World.” Review of Economics and Statistics 83(2), pp. 203-217.
Wu, Tao. 2005. “Estimating the ‘Neutral’ Real Interest Rate in Real Time.” FRBSF Economic Letter 05-27 (October 21).
Yellen, Janet. 2005. “Prospects for the U.S. Economy.” Speech to the Boalt Law School, University of California at Berkeley, Berkeley, CA, March 2.
Opinions expressed in FRBSF Economic Letter do not necessarily reflect the views of the management of the Federal Reserve Bank of San Francisco or of the Board of Governors of the Federal Reserve System. This publication is edited by Anita Todd and Karen Barnes. Permission to reprint portions of articles or whole articles must be obtained in writing. Please send editorial comments and requests for reprint permission to research.library@sf.frb.org