As discussed in a recent (Jones 2005), the share of health-care spending in GDP has been rising rapidly in the United States and other advanced industrial countries since at least 1960. For example, data from the U.S. Centers for Medicare and Medicaid Services (CMS) indicate double-digit annual increases in premiums for private health plans during the years 2001-2003, which significantly increased the overall share of business and household expenditures devoted to medical services.
As discussed in a recent (Jones 2005), the share of health-care spending in GDP has been rising rapidly in the United States and other advanced industrial countries since at least 1960. For example, data from the U.S. Centers for Medicare and Medicaid Services (CMS) indicate double-digit annual increases in premiums for private health plans during the years 2001-2003, which significantly increased the overall share of business and household expenditures devoted to medical services. As Jones (2005) and others have argued, the rapid increase in the price of medical care likely is demand-driven to a large degree, reflecting the high value that consumers in wealthy countries assign to medical technologies that improve the quality of life and extend its duration.
A potential flipside to rising health-care costs, however, is declining health-care coverage. As documented in a recent report from the U.S. Census Bureau (DeNavas-Walt et al. 2006), the percentage of uninsured Americans rose in 2005, continuing a trend that started around 2000. The recent decline in overall coverage reflects a longer-term trend towards reduced coverage through employer-sponsored insurance (ESI) plans. This dual pattern of rising prices and declining coverage suggests that some households are opting out of health coverage as its relative price rises. In this Economic Letter, we investigate the trend towards declining insurance coverage, focusing on the recent trends in ESI coverage and costs and underlying changes in employee participation rates. In the conclusion, we use available research results to project long-term coverage declines in response to further cost increases.
ESI coverage, offers, and “take-up”
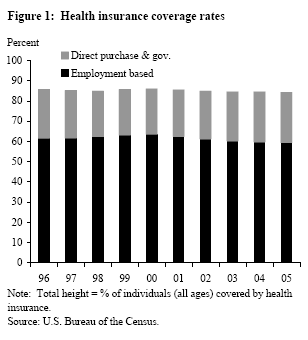
Each year, the U.S. Census Bureau publishes estimates of health insurance coverage in the prior year. The estimates are based on tabulations from a large, nationally representative sample of households, the Annual Social and Economic Supplement to the monthly Current Population Survey (CPS), conducted each March. Figure 1 displays the estimates of health insurance coverage rates for all individuals from this source for the period 1996-2005. To enhance comparability over time, we applied an adjustment to the data that accounts for a change in survey methodology in 1999 (see DeNavas-Walt et al. 2006, Table C-1).
As noted in the Census report and corresponding press coverage, the share of individuals lacking health insurance coverage from any source rose slightly (0.3 percentage points) between 2004 and 2005. Figure 1, which displays the rate of health coverage for the U.S. population decomposed into ESI and other sources (i.e., direct private purchases and government programs), shows that this most recent coverage decline reflects the continuation of a pattern that emerged after the year 2000. Since that year, the percentage of uninsured individuals has risen by 1.7 percentage points on net, representing a reduction in the number of insured individuals of about 5 million. Figure 1 also shows that the net decline in health coverage over this period reflects a pronounced decline in ESI coverage that was not fully offset by increased coverage through other sources (such as public programs). In particular, over the period displayed, ESI coverage fell from 63.6% in 2000 down to 59.5% in 2005; the drop in ESI coverage was evident for all age groups except individuals aged 55 and over. Coverage through direct private purchases also fell slightly over this period, reinforcing the decline in ESI. Coverage through government programs rose about 2½ percentage points over the same period, not enough to offset the decline in ESI and other private sources of coverage.
 The data displayed in Figure 1 suggest that ESI coverage declines have been the driving force for overall coverage trends in recent years. The Census data used in Figure 1 provide information on ESI coverage rates but do not indicate the extent to which the changes have been due to reduced availability of insurance plans from employers (ESI “offers”), tighter eligibility requirements for individual employees, or reduced employee participation in available plans (the latter two factors determine employee “take-up” of offered plans). Identifying these underlying sources of declining coverage is important for understanding the economic reasons for the trend. Information on offers, eligibility, and participation is available from an alternative, employer-based survey conducted by the U.S. Agency for Healthcare Research and Quality, the Insurance Component of the Medical Expenditure Panel Survey (MEPS-IC; www.meps.ahrq.gov). Since 1996, this survey has been administered yearly to a nationally representative sample of about 40,000 private business establishments, plus 2,500-3,000 state and local government units; data currently are available through 2004. Due to limited availability of key series for the government sample, our MEPS tabulations are based on the sample of private sector establishments.
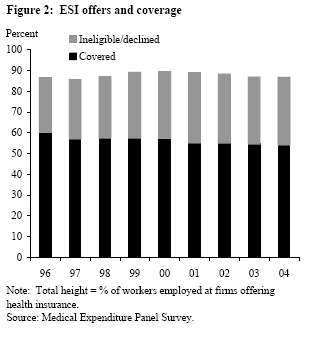
Figure 2 displays the percentage of workers employed by firms that offer ESI for the  years 1996-2004, decomposed into the percentage of workers who are ineligible for or decline offered coverage and those who accept (“covered”). The overall coverage rates vary from a high of 60.1% in 1996 down to 54.3% in 2004. (Note that these figures are not directly comparable to the ESI coverage rates from Figure 1, due to differences in the base sample and the inclusion of coverage through the ESI plan of a family member in Figure 1.) The figure shows that the tendency for employers to offer health insurance has been relatively constant, varying within a narrow band of about 87%-89%. By contrast, the share of workers who are ineligible for coverage or decline coverage that is offered to them rose from 26.4% in 1996 to 33.6% in 2001 and then stayed near that elevated level in subsequent years, ending at 32.4% in 2004. Although Figure 2 does not distinguish between employees who are ineligible for coverage offered by their employers and those who decline offered coverage, about one-third of the decline in take-up is due to declining eligibility and about two-thirds is due to declining participation. This suggests that most of the decline in take-up has been due to employee decisions, although some has been due to the imposition of tighter eligibility requirements by employers (longer waiting periods, more extensive health screening prior to receiving coverage, etc.).
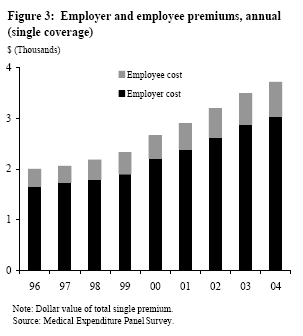
 Declining employee participation in ESI programs may relate to rising costs. Figure 3 displays the trend in the costs of ESI coverage (average premiums per enrolled employee, excluding family plans), tabulated from the MEPS-IC sample of private establishments for the period 1996-2004. The figure decomposes the total costs into the typical portion paid by employers and that paid by employees. Employers bear most of the direct cost burden of ESI coverage, and the share paid by employees has been relatively constant at about 17% over this period. At the same time, total premium costs have increased substantially, approximately doubling the direct premium contributions of firms and their workers between 1996 and 2004. Additional tabulations (not shown) reveal that the share paid by employees is higher at firms that employ relatively more low-wage workers (about 21% for low-wage firms, about 16% for high-wage firms); this increases the burden of rising costs for workers whose ability to pay is already constrained. Although we do not display ESI cost figures for family coverage plans, the patterns are similar to those for single coverage, with a higher but relatively constant share paid by employees (about 25%) and an approximate doubling in total premium costs between 1996 and 2004. These figures on ESI premiums may understate the full extent of increases in medical care costs for participating employees. In particular, for many ESI plans, deductibles and copayment amounts have increased along with premiums, further increasing out-of-pocket costs to plan participants (Gabel et al. 2002); however, in recent years these cost increases probably have been offset somewhat by the tax advantages conferred through medical savings accounts.
As noted above (Figure 2), most of the drop in coverage has occurred because employees are increasingly declining coverage that is offered to them, suggesting that cost increases are directly affecting employees’ participation decisions. This view is supported by recent research findings that use formal statistical analysis to investigate the link between rising costs and declining coverage. For example, Kronick and Gilmer (2005) found that most of the decline in ESI coverage between 1987 and 2002 is attributable to declining affordability (i.e., more rapid growth in premiums than in personal income); Chernew et al. (2005) also found that rising health insurance costs are the dominant explanation for falling coverage over time.
Based on CMS projections, Kronick and Gilmer (2005) estimate that health-care costs will outstrip income gains by 2.8 percentage points annually during the years 2002 through 2013. Given the research findings of systematic links between rising costs and declining ESI coverage, it is likely that this will lead to further coverage declines. Kronick and Gilmer predicted that ESI coverage (for nonelderly workers) will decline by four percentage points between 2002 and 2013; the data displayed in Figure 1 suggest that about one-half of this total decline (1.8 percentage points for the total population) had already occurred by 2005. Looking further ahead, Jones (2005) predicted that the share of health-care spending in GDP may rise to 25%-35% by 2050 (from 16.0% in 2004). The midpoint of this estimate (30%) is consistent with growth in the medical spending share of GDP at roughly half the pace assumed by Kronick and Gilmer for the years 2002-2013. However, even with this slower pace of growth in relative health spending, the implied decline in ESI coverage is 7.1 percentage points, reducing the coverage rate from its 2005 level of 59.5% (Figure 1) to 52.4% in 2050. On the current population base of 300 million, this implies about a 21-million person increase in the uninsured population, absent offsets from other sources of insurance.
The determinants of these trends may change over time, limiting the realized decline in ESI coverage. However, our rough calculations provide a sense of the extent of potential coverage declines. The corresponding policy implications are important: declining ESI coverage increases the cost burden on government insurance programs. Thus, while the work of Jones (2005) and others suggests that increased health spending is demand-driven, hence worthwhile in terms of economic efficiency, the potential impact on the extent of coverage may pose difficult choices for households and policymakers going forward.
Tom Buchmueller
Professor, The Ross School of Business, University of Michigan,
and Visiting Scholar, FRBSF
Rob Valletta
Research Advisor
[URLs accessed September 2006.]
Chernew, Michael, David M. Cutler, and Patricia Seliger Keenan. 2005. “Increasing Health Insurance Costs and the Decline in Insurance Coverage.” Health Services Research 40(4), pp. 1021-1039.
DeNavas-Walt, Carmen, Bernadette D. Proctor, and Cheryl Hill Lee. 2006. “Income, Poverty, and Health Insurance Coverage in the United States: 2005.” U.S. Census Bureau, Current Population Reports P60-231. Washington, DC: U.S. Government Printing Office.
Gabel, Jon, et al. 2002. “Job-Based Health Benefits in 2002: Some Important Trends.” Health Affairs 21(5), pp. 143-151.
Jones, Charles I. 2005. “More Life vs. More Goods: Explaining Rising Health Expenditures.” FRBSF Economic Letter 2005-10 (May 27).
Kronick, Richard, and Todd Gilmer. 2005. “It’s the Premiums, Stupid: Projections of the Uninsured through 2013.” Health Affairs Web Exclusive, April 5.
Opinions expressed in FRBSF Economic Letter do not necessarily reflect the views of the management of the Federal Reserve Bank of San Francisco or of the Board of Governors of the Federal Reserve System. This publication is edited by Anita Todd and Karen Barnes. Permission to reprint portions of articles or whole articles must be obtained in writing. Please send editorial comments and requests for reprint permission to research.library@sf.frb.org