Most people barely think twice anymore when they discover that their toothbrush was made in China, their tee-shirt was made in Honduras, and their car was made in Germany. With an increasing volume of goods and services flowing around the world, it is natural to assume that the marketplace has become “global,” which is to say, much more integrated.
Pacific Basin Notes. This series appears on an occasional basis. It is prepared under the auspices of the Center for Pacific Basin Studies within the FRBSF’s Economic Research Department.
Most people barely think twice anymore when they discover that their toothbrush was made in China, their tee-shirt was made in Honduras, and their car was made in Germany. With an increasing volume of goods and services flowing around the world, it is natural to assume that the marketplace has become “global,” which is to say, much more integrated. One implication of greater integration among the world’s markets is that prices for equivalent goods and services from country to country should tend to converge.
This Economic Letter reports on recent research that analyzes trends in global prices over the past decade and a half (Bergin and Glick 2007). It finds that, in fact, according to one measure, there was a trend of convergence from 1990 through 1997, which is consistent with the view that the world has become increasingly more trade-integrated over time, due to fewer governmental barriers and declining costs for transportation and communication. Somewhat surprisingly, however, it also finds that this trend was interrupted and then reversed in subsequent years, implying a general U-shaped pattern over the past one and a half decades. In exploring possible factors accounting for this reversal, a likely suspect turns out to be the hike in oil prices in recent years, which has raised transportation costs.
Our measure of price dispersion is constructed from data on actual price levels obtained from the Worldwide Cost of Living Survey conducted by the Economist Intelligence Unit (EIU), which records local prices for over 160 individual goods and services in more than 120 cities worldwide. The goods are narrowly defined—for example, “apples (1 kg),” “men’s raincoats (Burberry type),” and “light bulbs (2, 60 watt).” All prices are recorded in local currency and converted into dollars.
The EIU database does not contain a price quote for all goods and cities in every year. Since we are interested in how prices vary both from country to country and over time, we assembled data for the same set of tradable products for cities where generally no more than 30% of the observations were missing in any given year. The resulting panel consists of price data on 101 tradable products in 108 cities in 70 countries for the period 1990 to 2005, the last year for which we have data.
We use these data to compare price level differences across cities in different locations and countries. For example, for a given pair of cities, say, London and New York, we compute the difference in the dollar price level of each good, such as tomatoes (specifically, the log of the ratio of the price levels of tomatoes in the two locations). We then define price dispersion for each pair of cities as the mean of squared price differences across all 101 traded goods. (We square the price differences before calculating the mean because we care only about the magnitude of price differences, not whether prices are higher or lower in one country than in another.)
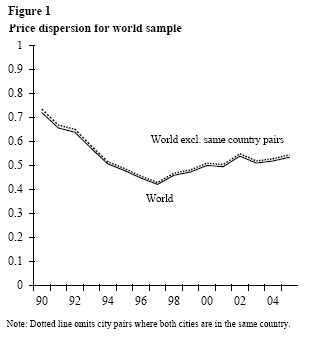
 The solid line in Figure 1 presents our measure of price dispersion averaged over all city-pairs on a year-by-year basis over the period 1990 to 2005; a rough U-shaped pattern is apparent, with dispersion falling from 1990 to 1997 and then gradually rising through 2005. The dotted line plots results that exclude city pairs within the same country, and clearly, the pattern is little changed. The fact that this line is somewhat higher implies that price dispersion is less among cities within the same borders.
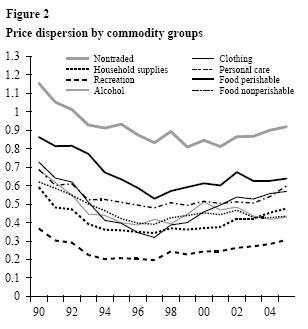
Further analysis (not shown) indicates that the U-shape applies broadly across various subgroupings of countries, that is, for city pairs where both are in industrial countries, both are in developing countries, and one city is in an industrial country and the other is in a developing country. For city pairs within the eurozone alone and for U.S. pairs, the degree of “U-ness” is shallower, but it still holds. In addition, as shown in Figure 2, the U-pattern is present when we break the data into particular commodity groups. (For comparison, we also show the pattern of price dispersion for a set of nontraded goods.) While there are clear differences between commodity groups in terms of average levels of price dispersion—high dispersion among perishable food items, and low dispersion among household supplies—the U-shaped pattern over time is consistent across almost all of the commodity groups, with falling levels of dispersion until 1997 and rising dispersion afterward.
Determinants of price dispersion
To explore further the determinants of the pattern of price dispersion in our sample, we conducted a formal statistical analysis. Specifically, we modeled price dispersion between any two cities as a function of standard trade friction determinants, such as the distance between the cities, language differences, adjacent national borders, tariff barriers, and institutional arrangements, including membership in regional trade agreements or currency unions. Also included are city and year dummy variables to capture factors that may affect the dispersion in prices between cities and over time that are not otherwise modeled.
 Regression results for the full world data set indicate that price dispersion increases with distance and tariffs, and it decreases when the cities are in the same country, when they share a border, and when they share a language. In addition, price dispersion declines when countries participate in a regional trade agreement or in a currency union. However, the U-shaped pattern over time remains, indicating that it is not attributable to the “usual suspect” variables studied in past research. (The U-shaped time pattern is captured in the regression by the estimated coefficients for the time variable dummies.)
Therefore, we considered several other factors. One is exchange rate variability, as measured by the nominal exchange rate volatility or the occurrence of a currency crisis. If exchange rate variability has increased in recent years, this might have contributed to the greater price dispersion observed in the data. In fact, we found that neither measure of exchange rate variability is time-varying in a way that is helpful in explaining the U-shaped pattern of price dispersion. The yearly means of exchange rate volatility and the occurrence of currency crises across the pairs in the sample take on large values in several points during our sample period (1992, 1997-1998, and 2002), but no U-shape is evident. This is confirmed by regressions, which find that greater price dispersion is associated with greater exchange rate variability, but the latter does not account for the U-shaped time variation in price dispersion.
Another avenue we explored is whether the relationship between our explanatory factors and price dispersion has shifted over time. For example, there is some evidence that the pass-through of exchange rate movements to import prices has fallen over time, so that a given depreciation of a country’s currency leads to a smaller increase in import prices in the local currency. Lower pass-through implies that price changes in one country are less likely to lead to price changes in other countries, and therefore to more price divergence. While we do find statistically significant variation over time in the sensitivity of price dispersion to exchange rate volatility, this variation does not appear to correspond much with the U-shaped pattern in price dispersion.
However, in a similar exercise examining the variation in the sensitivity of price dispersion to distance, we find a rough U-shape is apparent, with the sensitivity to distance first declining and then rising. This suggests that some common factor affecting the cost of transporting goods a given distance may be at work.
Pursuing this possibility, we search for additional variables that vary over time and that are related to distance. An obvious candidate is the price of oil, which has varied significantly over time and affects transportation costs. If oil prices raise transportation costs, they should increase differences in the prices of imported goods, raising average price dispersion. In addition, they should raise costs proportionately more for countries farther apart.
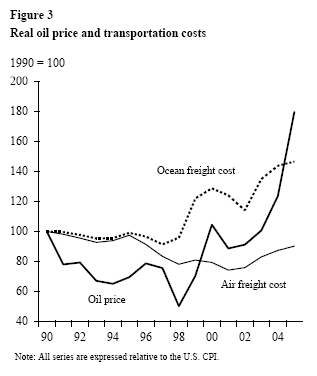
 In fact, a plot of oil prices (relative to the U.S. Consumer Price Index, CPI) in Figure 3 shows that it is time-varying in a manner that roughly coincides with the pattern in price dispersion, in that the price of oil reached a low point in the sample shortly after 1997 and rose gradually in subsequent years. For comparison, the figure also plots measures of U.S. air and freight transport costs, which also rose at the end of the sample. In the absence of a general measure of world transport costs, we use oil prices to proxy for trends in such costs in regressions. We find this variable is highly significant and associated with increased price dispersion. We also find that a rise in the price of oil has a bigger impact on price dispersion if two countries are far apart. This clearly lends support to the transportation cost story.
The basic findings of our analysis hold under a variety of alternative formulations, namely, omitting any city without data for all 15 years of the sample period, including only one city per country, using different measures of price dispersion, and considering additional control variables, such as international differences in GDP per capita, GDP, or wages.
Our analysis finds significant variation over time in the degree of global price convergence over the past 15 years. In particular, there appears to be a general U-shaped pattern with rising price dispersion in recent years, a pattern which is remarkably robust across country groupings and commodity groups. This time-variation is difficult to explain in terms of the explanatory factors common in the literature, as these tend not to vary much over time. However, regression analysis indicates that this time-varying pattern coincides well with oil price and transport cost fluctuations, which clearly vary over time and have risen in recent years.
Reuven Glick
Group Vice President
Bergin, Paul, and Reuven Glick. 2007. “Global Price Dispersion: Are Prices Converging or Diverging?” Journal of International Money and Finance 26(5) pp. 703-729 (September).
Opinions expressed in FRBSF Economic Letter do not necessarily reflect the views of the management of the Federal Reserve Bank of San Francisco or of the Board of Governors of the Federal Reserve System. This publication is edited by Anita Todd and Karen Barnes. Permission to reprint portions of articles or whole articles must be obtained in writing. Please send editorial comments and requests for reprint permission to research.library@sf.frb.org