Despite a severe recession and modest recovery, real wage growth has stayed relatively solid. A key reason seems to be downward nominal wage rigidities, that is, the tendency of employers to avoid cutting the dollar value of wages. This phenomenon means that, in nominal terms, wages tend not to adjust downward when economic conditions are poor. With inflation relatively low in recent years, these rigidities have limited reductions in the real wages of a large fraction of U.S. workers.
Figure 1
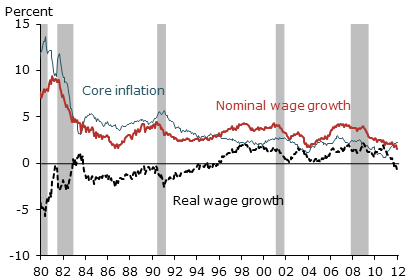
Inflation and wage growth through business cycles
Sources: Bureau of Labor Statistics and authors calculations.
Real wage growth, that is, wage growth after accounting for inflation, has held up surprisingly well in the recent recession and recovery. Despite modest economic growth and persistently high unemployment, real wage growth has averaged 1.1% since 2008. As Figure 1 shows, this pattern contrasts notably with previous decades, when real wage growth slowed substantially in response to business cycle downturns.
One reason real wage growth has been so solid is that inflation has been low, with the personal consumption expenditures price index increasing at an average annual rate of 1.8% since the start of 2008. Low inflation means that employers cannot reduce real wages simply by letting inflation erode the value of worker pay. Instead, if they want to reduce real labor costs, they must cut the actual dollar value of wages. Employers generally avoid doing so because cuts to nominal wages can reduce morale and prompt resistance even in difficult economic times (Kahneman, Knetsch, and Thaler 1986).
The inability or unwillingness of employers to reduce nominal pay is known as downward wage rigidity. When economic conditions are poor, this rigidity can disrupt normal labor market functioning, especially in a low-inflation environment. If wages are downwardly rigid, workers may receive false signals about the value of remaining in a particular occupation or industry. For example, consider construction workers who are less productive now than they were five years ago because of the bursting of the housing bubble. If their wages fell, they might seek jobs in other industries. Because of downward wage rigidity, they may stay in construction instead. On the labor demand side, employers that can’t cut wages may delay expanding payrolls as conditions improve. Either way, downward nominal wage rigidities can result in misallocation of resources in the economy.
In this Economic Letter, we describe how economists identify nominal wage rigidities. We then update evidence of downward nominal wage rigidities over time, focusing on the behavior of nominal wages since the start of the recent recession.
Data and methods
Our analysis is based on individual-level data from 1980 through 2011 from the Current Population Survey (CPS), the monthly survey conducted by the Bureau of Labor Statistics used to measure the unemployment rate. Survey respondents are interviewed eight times over 16 months and asked to report their earnings near the beginning of their time in the survey and then a year later near the end of their survey tenure. We examine the subset of workers in the CPS who did not change jobs during the year in which they reported earnings. We consider both salaried workers and hourly wage workers, excluding those receiving the federal or state minimum wage, since employers cannot legally reduce their pay. For salaried workers, we calculate an hourly wage rate by dividing weekly earnings by hours worked. For hourly workers, we use their reported hourly wage. Following the methodology of Card and Hyslop (1996), we compute a nominal wage change for each worker in our sample based on pay as reported early in the survey and a year later.
Our final data set consists of 12-month rolling panels of wage data from January 1980 to December 2011, which we use to evaluate trends in the behavior of nominal wage changes. For details and a technical explanation of using the CPS data to track wage changes, see Daly, Hobijn, and Wiles (2011).
Measuring nominal wage rigidities
Figure 2
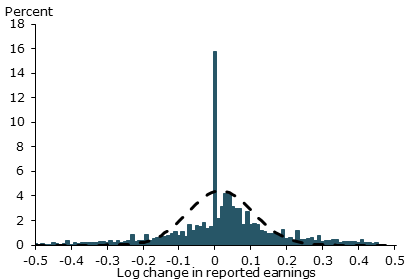
Distribution of observed nominal wage changes
Sources: Current Population Survey (CPS) and authors calculations.
Figure 3
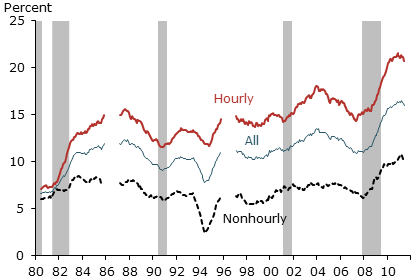
No wage changes: Hourly and nonhourly workers
Source: CPS and authors calculations.
Note: Breaks in lines associated with privacy recodes and survey redesign.
Figure 4
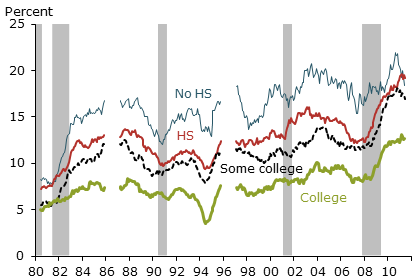
No wage changes by education level
Source: CPS and authors calculations.
Figure 5
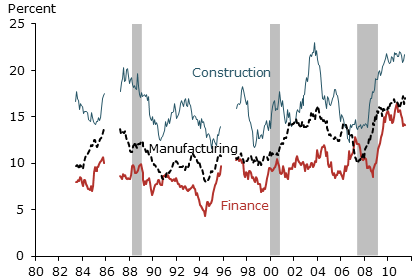
No wage changes by industry
Source: CPS and authors calculations.
Researchers generally point to asymmetries in the distribution of observed wage changes among individual workers as evidence of nominal wage rigidities. Figure 2 plots an example of this type of wage change distribution in 2011. The dashed black line shows a symmetric normal distribution. The blue bars plot the actual distribution of nominal wages.
The figure’s most striking feature is the blue bar that spikes at zero, indicating the large number of workers who report no change in wages over a year. This spike stands out in the distribution of actual wage changes, suggesting that, rather than cutting pay, employers simply kept wages fixed over the year. This is supported by the large gap to the left of zero between the actual distribution of wage changes and the dashed black line representing the normal distribution. This gap suggests that the spike at zero is made up mostly of workers whose wages otherwise would have been cut.
Downward nominal wage rigidities over the business cycle
To understand whether such downward nominal wage rigidities might be important to the performance of the economy, we need to look at how common such rigidities are over the business cycle. Figure 3 plots the percentage of workers in the same job who report no year-over-year wage change. The figure includes data for all workers, and for hourly and salaried workers separately. As the figure shows, downward nominal wage rigidities begin to rise in recessions for both hourly and salaried workers. Wages mostly change on a yearly basis. For that reason, the prevalence of such rigidities typically lags the actual downturn of the economy, but then persists well into the recovery.
During the recent recession and recovery, the run-up in the fraction of workers subject to downward nominal wage rigidity has been especially large. From 2007 to the end of 2011, the fraction of workers experiencing no yearly wage change rose to 16% from 11.2%. This is five percentage points higher than the average size of the spike at zero from 1983 to 2007, and higher than in any period in our sample.
Downward nominal wage rigidities by education
This phenomenon has affected a broad range of workers during the recent period. Figure 4 plots the share of workers receiving no wage change by education. Less-educated workers have historically been more likely to get no yearly wage change. Recently though, the percentage of workers with no wage change has increased markedly at all education levels. This contrasts with the business cycles of the early 1990s and 2000s, when more-educated workers were shielded to a greater extent from increases in nominal wage rigidities. In fact, in the recent period, zero wage changes increased almost as much for college-educated workers as for workers with less than a high school education. That has not been seen in any other period in our sample, suggesting that a broad range of employers in a variety of sectors might feel pressure to cut wages, but are unable to do so because of downward nominal wage rigidity.
Downward nominal wage rigidities by industry
Workers in industries hit particularly hard in the recent recession might be considered more likely to see no wage change than workers in industries that fared relatively better. For example, construction and financial services did particularly poorly in the recession because of the housing bust and financial crisis. Consequently, relatively more workers in those industries might be expected to have their wages stay the same.
Nonetheless, the increase in the percentage of workers holding the same job whose wages were unchanged is remarkably consistent across industries. Figure 5 plots the fraction of workers receiving no nominal change in their wage across three sectors: construction, financial services, and manufacturing. In all three sectors, the percentage of workers reporting a wage change of zero rose. Although the increase was especially large in construction, it’s notable that all three sectors experienced a large run-up in the fraction of workers reporting no yearly change in their wage.
The breadth of the increase in workers reporting no wage change suggests that downward nominal rigidities pervade a broad array of industries. Nonetheless, there is also evidence that downward rigidities are more common in industries hit hardest by the recession, such as construction. If this is true, downward rigidities may be preventing necessary adjustments across industries in the economy.
Conclusion
The distribution of the dollar value of wage changes suggests that a significant fraction of workers are affected by downward nominal wage rigidities. Our analysis, based on data through the end of 2011, suggests that downward nominal wage rigidities have affected a much larger share of the workforce in recent years. The fraction of workers reporting a wage change of zero is higher now than at any point in the past 30 years. This may partly explain why real wage growth has not significantly declined since the onset of the recession in December 2007 and why hiring has been slow since the start of the recovery in mid-2009. Because nominal wage growth for a large fraction of workers has been held to zero, a somewhat higher rate of inflation would grease the wheels of the labor market by allowing real wages to fall (Akerlof, Dickens, and Perry 1996).
References
Akerlof, George A., William T. Dickens, and George L. Perry. 1996. “The Macroeconomics of Low Inflation.” Brookings Papers on Economic Activity 1996(1).
Card, David, and Dean Hyslop. 1996. “Does Inflation ‘Grease the Wheels of the Labor Market’?” National Bureau of Economic Research Working Paper 5538.
Daly, Mary C., Bart Hobijn, and Theodore S. Wiles. 2011. “Aggregate Real Wages: Macro Fluctuations and Micro Drivers.” FRBSF Working Paper 2011-23.
Kahneman, Daniel, Jack L. Knetsch, and Richard Thaler. 1986. “Fairness as a Constraint on Profit Seeking: Entitlements in the Market.” American Economic Review 76(4).
Opinions expressed in FRBSF Economic Letter do not necessarily reflect the views of the management of the Federal Reserve Bank of San Francisco or of the Board of Governors of the Federal Reserve System. This publication is edited by Anita Todd and Karen Barnes. Permission to reprint portions of articles or whole articles must be obtained in writing. Please send editorial comments and requests for reprint permission to research.library@sf.frb.org