Federal fiscal policy during the recession was abnormally expansionary by historical standards. However, over the past 2½ years it has become unusually contractionary as a result of several deficit reduction measures passed by Congress. During the next three years, we estimate that federal budgetary policy could restrain economic growth by as much as 1 percentage point annually beyond the normal fiscal drag that occurs during recoveries.
The current recovery has been disappointingly weak compared with past U.S. economic recoveries. Researchers and policymakers have pointed to a number of potential causes for this unusual weakness, including contractionary fiscal policy. For example, Federal Reserve Vice Chair Janet Yellen (2013) argues that three tailwinds that typically help drive strong recoveries—investment in housing, consumer confidence, and discretionary fiscal policy—have been absent or turned into headwinds this time.
Changes in fiscal policy have been substantial over the past two years, including passage of the Budget Control Act of 2011, which led to sequestration spending cuts. In addition, temporary payroll tax cuts expired and income tax rates for higher-income taxpayers rose following passage of the American Taxpayer Relief Act of 2012. Two important questions are how much has federal fiscal policy been a drag on growth in the recovery to date and to what extent will it affect growth over the next few years? Moreover, is this fiscal drag unusual or part of the normal pattern in which government spending tends to fall and tax collections tend to rise as economic activity gains momentum?
In this Economic Letter, we examine these questions by estimating what fiscal policy would be if it followed historical patterns in the relationship between fiscal policy and the business cycle. We then compare this historically based estimate with actual fiscal policy during the recession and recovery to date. We also look at government projections of fiscal policy over the next three years to see how these compare with estimates based on the historical norm. Finally, we discuss what these trends in federal fiscal policy imply for economic growth.
The historical norm of federal fiscal policy
Historically, fiscal policy tends to be expansionary in recessions. As economic activity slows, tax revenue falls and government spending rises, giving a boost to the economy. The opposite occurs during expansions, as tax revenue rises and government spending falls. Much of this countercyclical pattern is by design. During a recession, so-called automatic stabilizers kick in. These are programs that boost government spending and reduce tax receipts without explicit legislative action. For example, income taxes fall and unemployment insurance and Medicaid automatically rise during downturns, adding to the federal deficit and ideally stimulating economic activity. During upturns, the process automatically reverses as spending on safety net and income-support programs falls and tax revenue rises, trimming the federal deficit.
Much of the analysis of the countercyclical effects of federal fiscal policy only takes these automatic stabilizer programs into account. For instance, the Congressional Budget Office regularly produces estimates of the cyclical component of the federal deficit based on automatic stabilizers (CBO 2013). Yet, automatic programs are only part of the picture. Discretionary fiscal policy, that is, legislated tax and spending changes, often tends to be countercyclical. Congress commonly passes temporary tax cuts or stimulus spending to counteract downturns. Therefore, to fully capture the cyclical effects of government budgetary trends, we consider both automatic stabilizers and discretionary fiscal policy.
To analyze whether recent fiscal policy has followed historical patterns, we use a statistical model of the relationship between fiscal policy and the business cycle based on three variables: government spending other than interest payments, tax revenue, and the difference between the two, which is known as the primary deficit (see Lucking and Wilson 2012). We measure these over time as a share of gross domestic product. We measure the business cycle using the difference between actual GDP and the CBO’s estimate of potential GDP, which is known as the output gap.
Our model allows us to estimate what fiscal policy is likely to be at any point in time given the state of the business cycle. We call these estimates the historical norm since they are based on the average historical relationship between fiscal policy and the business cycle. We can also use this model to estimate a historical-norm level of fiscal policy in coming years given CBO’s projections of the output gap.
Fiscal policy in the recession and the recovery
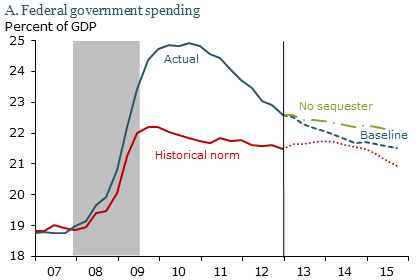
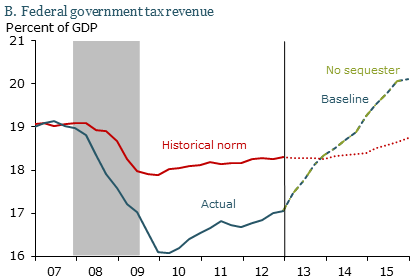
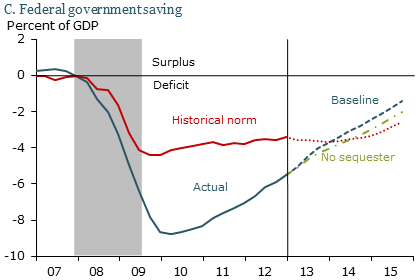
Figure 1 compares actual fiscal policy with estimates based on the historical norm for noninterest federal spending, tax revenue, and the primary deficit. It shows that federal fiscal policy was unusually expansionary during the Great Recession. Federal spending grew more and tax receipts fell more than usual, even taking into account the recession’s severe depth and duration, and the resulting very large output gap. This reflects both automatic stabilizers and discretionary changes in spending and tax policy, such as the American Recovery and Reinvestment Act, the economic stimulus program passed by Congress in 2009. As a consequence, federal government saving in the recession fell faster—that is, the deficit grew faster—than our historical norm would predict.
This more-expansionary-than-usual federal fiscal policy continued through the recession and into the early part of the recovery. But in mid-2010, fiscal policy sharply reversed course. Since then, federal fiscal policy has been much more contractionary than normal. Spending has fallen sharply since 2011, and tax revenue has grown faster than usual given the weak recovery. However, the larger-than-usual deficit growth early in the recovery has offset the larger-than-usual drop in the deficit since mid-2010. As a result, overall for the recovery, fiscal policy has been only slightly more contractionary than the historical norm.
Measuring excess fiscal drag in the recovery
Figure 1
U.S. fiscal policy: Projections vs. historical norm


Source: Bureau of Economic Analysis, CBO, and authors’ calculations.
Analysts often measure the “fiscal impetus” of policy, that is, how much policy changes contribute to real GDP growth over a given period. Positive impetus indicates expansionary policy changes and negative impetus, contractionary changes. Thus, fiscal impetus can be thought of as measuring the degree to which policy is a tailwind or headwind for economic growth.
Estimating fiscal impetus has two components. The first is the change in fiscal policy as a share of GDP. The second is the multiplier, that is, the change in GDP caused by a given change in government spending or taxes. Researchers do not agree on what multipliers are most accurate. Here, we use a multiplier of one, which is near the middle of the range of empirical estimates (see Wilson 2012). Doing so allows us to focus on the effects of changes in fiscal policy on fiscal impetus.
Figure 1 shows our calculations of fiscal impetus based on actual and historical-norm estimates of noninterest spending, tax revenue, and the primary deficit. In Figure 1, the vertical line divides our results into two periods: the recovery from mid-2009 to the end of 2012, and the three years through the end of 2015. We refer to the difference between historical-norm and actual fiscal impetus as the excess drag of fiscal policy. The excess drag tells exactly how much fiscal policy is slowing the current recovery beyond the historical norm.
Panel C of Figure 1 shows the actual and the historical-norm primary deficits. The fiscal impetus based on both the actual and historical-norm deficits since the start of the recovery has been identical, −0.2 percentage point per year. In other words, federal fiscal policy has been a modest headwind to economic growth so far in the recovery, but no more so than usual given the weak pace of growth.
Fiscal drag in coming years
To assess whether fiscal policies might cause excess drag in the future, we look at projections through 2015 from the CBO for the output gap, as well as for federal spending, revenue, and the deficit. We base our calculations on the CBO’s February 2013 outlook report, which contained scenarios both with and without the sequestration budget cuts, rather than the most recent May report, which omitted the scenario without sequestration. The results for the scenario including sequestration using the May projections are very similar to those based on the February projections.
While our estimates show that fiscal policy has held back the recovery slightly to date, the effect over the next three years looks much bigger. The CBO projects that the federal deficit as a share of GDP will drop 1.4 percentage points per year over the next three years. This projection would ease slightly to 1.2 percentage points per year if sequestration spending cuts were reversed. By contrast, our calculation of the historical-norm deficit decline through 2015 is 0.4 percentage point per year based on the CBO’s output gap projections. This implies that the excess drag from the rapidly shrinking deficit would reduce real GDP growth annually by between 0.8 and 1.0 percentage point, depending on whether sequestration is reversed. Thus, with or without sequestration, fiscal policy is expected to be a much greater drag on economic growth over the next three years than it has been so far.
Surprisingly, despite all the attention federal spending cuts and sequestration have received, our calculations suggest they are not the main contributors to this projected drag. The excess fiscal drag on the horizon comes almost entirely from rising taxes. Specifically, we calculate that nine-tenths of that projected 1 percentage point excess fiscal drag comes from tax revenue rising faster than normal as a share of the economy. As Panel B shows, at the end of 2012, taxes as a share of GDP were below both their historical norm in relation to the business cycle and their long-run average of about 18%. However, over the next three years, they are projected to rise much faster than our estimate of the usual cyclical pattern would indicate. The CBO points to several factors underlying this “super-cyclical” rise, including higher income tax rates for high-income households, the recent expiration of temporary Social Security payroll tax cuts, and new taxes associated with the Obama Administration’s health-care legislation.
Conclusion
Federal fiscal policy has been a modest headwind to economic growth so far during the recovery. This is typical for recovery periods and in line with the historical relationship between the business cycle and fiscal policy. However, CBO projections and our estimate based on the countercyclical history of fiscal policy suggest that federal budget trends will weigh on growth much more severely over the next three years. The federal deficit is projected to decline faster than normal over the next three years, largely because tax revenue is projected to rise faster than usual. Given reasonable assumptions regarding the economic multiplier on government spending and taxes, the rapid decline in the federal deficit implies a drag on real GDP growth about 1 percentage point per year larger than the normal drag from fiscal policy during recoveries.
References
Congressional Budget Office. 2013. “The Effects of Automatic Stabilizers on the Federal Budget as of 2013.” Report, March.
Lucking, Brian and Daniel Wilson. 2012. “U.S. Fiscal Policy: Headwind or Tailwind?” FRBSF Economic Letter 2012-20 (July 2).
Wilson, Daniel. 2012. “Government Spending: An Economic Boost?” FRBSF Economic Letter 2012-04 (February
6).
Yellen, Janet. 2013. “A Painfully Slow Recovery for America’s Workers: Causes, Implications, and the Federal
Reserve’s Response.” Remarks at the “A Trans-Atlantic Agenda for Shared Prosperity,” conference sponsored
by the AFL-CIO, Friedrich Ebert Stiftung, and IMK Macroeconomic Policy Institute, Washington, DC
(February 11).
Opinions expressed in FRBSF Economic Letter do not necessarily reflect the views of the management of the Federal Reserve Bank of San Francisco or of the Board of Governors of the Federal Reserve System. This publication is edited by Anita Todd and Karen Barnes. Permission to reprint portions of articles or whole articles must be obtained in writing. Please send editorial comments and requests for reprint permission to research.library@sf.frb.org