The Federal Reserve lowered its traditional monetary policy instrument, the federal funds rate, to essentially zero in December 2008. However, economic activity generally depends on interest rates with longer maturities than the overnight fed funds rate. Research shows that interest rates with maturities of two years or more were largely unconstrained by the zero lower bound until at least late 2011. This suggests that, despite the zero bound, the Fed has been able to continue conducting monetary policy through medium- and longer-term interest rates by using forward guidance and large-scale asset purchases.
The Federal Reserve’s main monetary policy instrument is the federal funds rate, which is the interest rate large banks charge each other to borrow reserves overnight. The Fed’s monetary policy committee, the Federal Open Market Committee (FOMC), lowered this rate essentially to zero in December 2008. Thereafter, the FOMC turned to unconventional measures to stimulate the economy, such as large-scale purchases of longer-term government bonds and communication about the future path of the federal funds rate, a practice known as forward guidance (see Williams 2012). This Economic Letter examines how much the near-zero federal funds rate has hindered the Fed’s ability to affect longer-term interest rates.
The federal funds rate vs. longer-term interest rates
The federal funds rate is directly relevant only for financial institutions that trade reserves in the federal funds market. What matters more for the economy is how changes in the fed funds rate pass through to other interest rates that are more relevant for businesses and consumers, such as the prime rate for business loans and interest rates on corporate bonds, auto loans, and mortgages. These loans generally have terms of several months or years, not just one night.
Nevertheless, the Fed can influence medium- and longer term interest rates through changes in the federal funds rate. Bond yields tend to move along with the expectations of financial market participants about the average fed funds rate over the life of the bond. If they didn’t, investors could profit by arbitrage that brought bond yields closer in line with the expected federal funds rate path.
But to what extent has the zero lower bound constraint on the federal funds rate limited the Fed’s ability to influence these longer-term yields? To investigate this question, it is natural to look at U.S. Treasury securities. Treasuries trade more frequently than private-sector debt, providing more timely interest rate data for a wide range of maturities.
The sensitivity of Treasury yields to economic news
In Swanson and Williams (2013), we demonstrate a new way to measure how much the zero lower bound constrains Treasury securities of any maturity. We look at how Treasury securities of different maturities respond to major macroeconomic announcements, such as reports on U.S. employment, gross domestic product, or consumer price inflation. These announcements have important implications for the U.S. economy and future monetary policy, and thus tend to move interest rates of all maturities.
In particular, we estimate the time-varying sensitivity of a given Treasury yield to major macroeconomic announcements relative to a benchmark period when the zero lower bound was not a concern, taken to be 1990–2000. If a particular Treasury yield responds to news today by just as much as it did in the 1990s, then we would say that Treasury yield is unconstrained by the zero lower bound. Alternatively, if a given Treasury yield used to respond to macroeconomic announcements in the 1990s, but no longer responds to those announcements today, then we would say that Treasury yield is completely constrained by the zero bound. A yield could also be partially constrained, that is, respond to news significantly less than normal. This statistical approach provides a rigorous test of whether any given yield is constrained by the zero lower bound and a quantitative measure of how much that yield is constrained.
Figure 1
Sensitivity of three-month Treasury yield to news
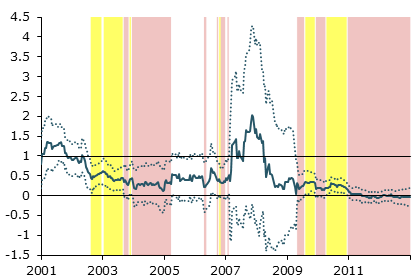
Figure 2
Sensitivity of two-year Treasury yield to news
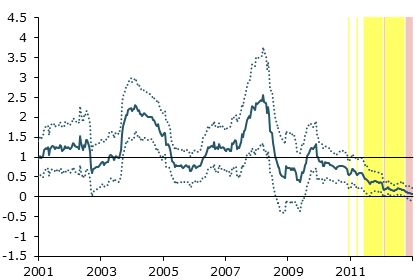
Figure 3
Sensitivity of 10-year Treasury yield to news
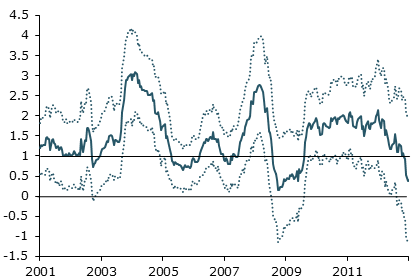
Figures 1 through 3 plot the results of this analysis for three-month, two-year, and 10-year Treasury securities, respectively. The solid blue lines show estimates of how sensitive the particular Treasury yield was to news in recent years, compared with the yield’s average sensitivity in the 1990s. Periods when the blue line is close to the horizontal line at 1 in these figures represent times when that Treasury yield responded fairly normally. Alternatively, periods when the blue line is close to the horizontal line at 0 represent times when that Treasury yield was largely or completely unresponsive to news. The range of uncertainty around the yield estimates is shown by the dotted lines above and below the blue lines.
In each figure, periods when the estimated Treasury yield sensitivity is significantly less than 1, that is, significantly less than normal, are shaded yellow. If the estimated Treasury sensitivity is not significantly greater than 0, that region is shaded red. Thus, yellow shaded regions represent periods when the Treasury yield was partially, but not completely, unresponsive to news, while red shaded regions are periods when the yield was essentially insensitive to news.
Figure 1 shows that the three-month Treasury yield varied from highly unresponsive to more than normally responsive to macroeconomic news between 2001 and 2012. From the spring of 2009 through the end of 2012, the yield was either partially or completely insensitive to news. It is natural to interpret this insensitivity as stemming from the zero lower bound, since the federal funds rate and three-month Treasury yields were both essentially zero from December 2008 through the end of our sample. Thus, our analysis finds that the zero lower bound substantially constrained Treasury yields at the shortest end of the yield curve from the spring of 2009 onward, as one would expect.
What is perhaps more surprising in Figure 1 is that the three-month Treasury yield was also partially or completely insensitive to news in 2003 and 2004, a period when the federal funds rate target and three-month Treasury yield never fell below 1%. However, the Fed had lowered the fed funds rate to 1% in June 2003. At the time, a fed funds rate below 1% was considered disruptive to markets (see Bernanke and Reinhart 2004). So, rather than lowering the rate any further, the FOMC switched to a policy of managing the public’s expectations for monetary policy through language used in FOMC statements and other communications. Thus, even though the fed funds rate was not at the zero lower bound, the three-month Treasury yield behaved as if it were constrained by a floor of 1%. The fact that the empirical method in Swanson and Williams (2013) picks up this monetary policy constraint is noteworthy.
Figure 2 shows that the two-year Treasury yield’s sensitivity to news was less attenuated than that of the three-month yield. For example, in 2003–04, the two-year yield closely followed its normal tendency in response to news, implying that it was relatively unaffected by the FOMC’s implicit lower bound of about 1%. Thus, it is reasonable to conclude that monetary policy’s effectiveness on the two-year Treasury yield was essentially normal in 2003–04.
The biggest surprise in Figure 2 is how late and how little the zero bound appears to have constrained the two-year Treasury yield after 2008. Only beginning in 2011 did yields of this maturity become significantly less sensitive than normal to news. Even then, they continued being partially responsive until late 2012. Thus, to the extent that the Fed can influence monetary policy expectations over a two-year horizon, the implication is that monetary policy was about as effective as usual until at least late 2011.
Results for the 10-year Treasury yield, shown in Figure 3, are also remarkable. The sensitivity of the 10-year yield to news was never significantly less than normal over this period. Even in late 2011 and 2012, when medium-term Treasury yields were more constrained, long-term yields remained largely unaffected by the zero lower bound, except possibly in the last few weeks of 2012, when the 10-year yield’s sensitivity did fall appreciably below normal.
Implications of sensitivity
The results in Figures 1 to 3 suggest that monetary policy was less constrained by the zero lower bound between 2009 and 2012 than is often recognized. Even though the zero bound severely constrained very short-term interest rates throughout this period, two-year Treasury yields do not appear to have been significantly affected until late 2011, and 10-year Treasury yields remained almost unaffected. Thus, there was still significant room for monetary policy to affect yields and the economy through the end of 2012. Indeed, on several occasions during this period, the FOMC was able to use forward guidance and large-scale asset purchases to push down medium- and longer-term Treasury yields by as much as 0.20 percentage point (see Gagnon et al. 2011 and Williams 2011). In normal times, it would take a federal funds rate cut of about 0.75 to 1 percentage point to produce a decline in medium- and longer-term yields of this magnitude (see Williams 2012 and Gürkaynak, Sack, and Swanson 2005).
These results also have interesting implications for fiscal policy. If monetary policy is constrained by the zero lower bound, then fiscal policy is generally more powerful because monetary policy and interest rates won’t respond to changes in fiscal policy. In other words, at the zero lower bound, interest rates will not “crowd out” the effects of fiscal policy (see Woodford 2011 and Christiano, Eichenbaum, and Rebelo 2012). The results presented here suggest that longer-term interest rates—which matter more for private-sector spending—were not significantly constrained by the zero lower bound until at least late 2011. So it’s unlikely that the effects of fiscal policy were much greater than normal before then.
Conclusion
The zero lower bound has substantially constrained the federal funds rate, the Federal Reserve’s traditional monetary policy instrument, since December 2008. However medium- and longer-term interest rates have been much less affected. To the extent that the Fed can affect these longer-term interest rates through forward guidance and large-scale purchases of longer-term bonds, the zero lower bound appears not to have constrained monetary policy as much as is sometimes believed.
References
Bernanke, Ben S., and Vincent R. Reinhart. 2004. “Conducting Monetary Policy at Very Low Short-Term Interest Rates.” American Economic Review 94(2), pp. 85–90.
Christiano, Lawrence, Martin Eichenbaum, and Sergio Rebelo. 2011. “When Is the Government Spending Multiplier Large?” Journal of Political Economy 119(1), pp. 78–121.
Gagnon, Joseph, Matthew Raskin, Julie Remache, and Brian Sack. 2011. “The Financial Market Effects of the Federal Reserve’s Large-Scale Asset Purchases.” International Journal of Central Banking 7(1), pp. 3–43.
Gürkaynak, Refet S., Brian Sack, and Eric T. Swanson. 2005. “Do Actions Speak Louder Than Words? The Response of Asset Prices to Monetary Policy Actions and Statements.” International Journal of Central Banking 1(1), 55-93.
Swanson, Eric T., and John C. Williams. 2013. “Measuring the Effect of the Zero Lower Bound on Medium- and Longer-Term Interest Rates.” FRB San Francisco Working Paper 2012-02.
Williams, John C. 2011. “Unconventional Monetary Policy: Lessons from the Past Three Years.” FRBSF Economic Letter 2011-31.
Williams, John C. 2012. “The Federal Reserve’s Unconventional Policies.” FRBSF Economic Letter 2012-34.
Woodford, Michael. 2011. “Simple Analytics of the Government Expenditure Multiplier.” American Economic Journal: Macroeconomics 3(1), pp. 1–35.
Opinions expressed in FRBSF Economic Letter do not necessarily reflect the views of the management of the Federal Reserve Bank of San Francisco or of the Board of Governors of the Federal Reserve System. This publication is edited by Anita Todd and Karen Barnes. Permission to reprint portions of articles or whole articles must be obtained in writing. Please send editorial comments and requests for reprint permission to research.library@sf.frb.org