Since the Great Recession, standard ways of measuring the labor market have given mixed signals about the strength of the U.S. recovery. This has increased the uncertainty around how to interpret job market conditions, which has made calibrating monetary policy to achieve full employment more challenging. Ultimately, policymakers need to make judgments about how much these conflicting indicators reflect cyclical weakness in the job market versus structural factors that would be less easily remedied with monetary policy.
In her August 22 speech in Jackson Hole, Federal Reserve Chair Janet Yellen (2014) highlighted the significant uncertainty policymakers face in assessing the state of the labor market. The uncertainty Yellen noted is particularly evident in unemployment data, where signals from different measures have diverged considerably in recent years. In this Economic Letter we discuss what several measures of labor market slack tell us about conditions in the labor market and the implications for monetary policy. Using a simple policy rule, the well-known Taylor rule, we show that policy prescriptions vary considerably across measures. Our results highlight the importance of the current debate about whether labor market indicators represent persistent cyclical weakness or more permanent structural factors.
This is the second in a two-part series. The first part (Elias, Irvin, and Jordá 2014) provides an overview of mixed signals coming from measures of output and the labor market.
Assessing labor market slack
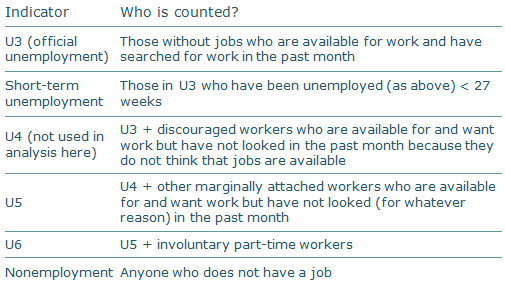
Table 1
Definitions of measures of labor market slack

The Bureau of Labor Statistics (BLS) publishes several measures that can be used to evaluate labor market slack, or the degree to which labor resources are being underutilized (see Table 1). The most commonly cited is the official unemployment rate. This measures the percentage of the civilian non-institutionalized adult population without a job and actively searching for work. This measure, which the BLS calls U3, is a long-standing bellwether of labor market conditions and is frequently used to gauge whether the economy has achieved full employment.
Recognizing that no single measure completely summarizes the state of the labor market, the BLS publishes other measures that broaden the definition of slack by including people who are interested in working but not actively searching (U4 and U5) and who would like to work full-time but can only find part-time jobs (U6). The BLS also publishes more narrow measures of slack by dividing the total number of jobless into shorter and longer term unemployed.
Finally, the BLS measures the fraction of the adult population employed and not employed, regardless of whether they want to work or not. Known respectively as the employment to population and nonemployment to population ratios, these are the broadest indicators of labor market slack. They have historically been much more sensitive to changes in demographics and in work activity of particular groups, such as women.
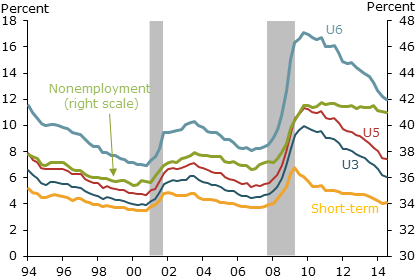
Figure 1
Measures of labor market slack

Source: BLS and authors’ calculations.
Notes: See Table 1 for definitions of terms. Gray bars indicate NBER recessions.
Figure 1 shows a representative set of these labor market metrics from 1994, the first year of data for many series, through the third quarter of 2014, the latest quarter available. Recessions, as dated by the National Bureau of Economic Research, are shown with gray bars. Unemployment—U3, U5, U6, and short-term unemployment—are measured on the left axis, and the nonemployment rate is measured on the right axis.
There are several things to note in the figure. First, although estimated levels of slack vary, the dynamics of the measures are similar. When the economy is expanding, all the rates fall. During recessions, conditions reverse and all the rates rise. Over the entire sample, the estimated average correlation among these series is over 0.9, confirming the visual impression of a high degree of comovement. This comovement is one reason the headline unemployment rate is considered a reliable summary measure of overall labor market slack.
In keeping with the normal historical pattern, during the Great Recession all measures of slack increased sharply, several of them rising to unprecedented levels. Since then, however, improvement across measures has been quite uneven, with some improving quite rapidly while others have recovered more slowly. In fact, since the Great Recession the average correlation across series has dropped to 0.7, a notable departure from the historical norm.
The uneven recovery across these measures has increased uncertainty about whether the economy is approaching or still far from full employment. Such uncertainty represents an important challenge for policymakers trying to decide on the appropriate course for monetary policy.
Conflicting policy prescriptions
One way to see how conflicting signals from the labor market affect monetary policy is by applying a simple policy rule. As in Elias, Irvin, and Jordà (2014), we use a benchmark version of the Taylor (1999) rule that relates interest rates to inflation and economic slack. In this version of the rule, the policy rate can be expressed as follows:
Target rate = 1.25 + (1.5 × Inflation) – (2 × Labor market gap).
We measure inflation using the personal consumption expenditures price index (PCEPI) excluding food and energy. This measure is commonly referred to as core PCE inflation. Although the Federal Reserve is ultimately interested in ensuring that headline inflation remains stable, core inflation is significantly less volatile and therefore may be considered a more reliable measure (see, for example, Bernanke 2007).
Since there is no published measure of the labor market gap, we produce estimates based on the BLS data. Following standard practice, we measure the headline unemployment gap as the percentage point difference between the published monthly unemployment rate (U3) and an estimate of the natural rate of unemployment provided by the Congressional Budget Office. For other measures, we calculate natural rates as the average value of the series between 1994 and 2004.
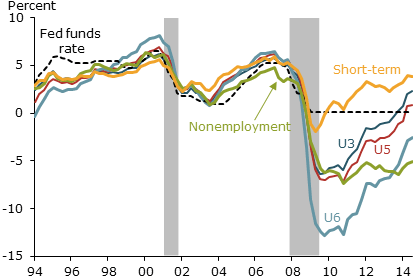
Figure 2
Actual and alternative policy rates

Source: BLS, BEA, and authors’ calculations.
Notes: U3 gap from CBO; others are 1994–2004 averages. See Table 1 for definitions of terms. Gray bars indicate NBER recessions.
With these gap estimates, we can use the Taylor rule to compare the policy prescriptions associated with our five measures of labor market slack, shown in Figure 2, with the federal funds rate. Until the end of 2008, when the policy rate was constrained by the zero lower bound, the simple U3 Taylor rule closely tracked the actual path of the federal funds rate. Furthermore, before the Great Recession this close association with the actual policy rate holds for all five measures of labor market slack. This implies that for the first 15 years of the sample, 1994 through 2008, policymakers received roughly the same signal about the appropriate interest rate no matter which labor market indicator they used. This is not surprising given the high correlation among these indicators before the Great Recession (see Figure 1) and it highlights just how clear the signal coming from the labor market was at that time.
Since the recession, the story has changed. As Figure 2 shows, policy rate prescriptions vary considerably across measures of unemployment. In particular, if we measure the labor market gap using short-term unemployment gap, the recommended policy rate would have moved above zero in 2009 and would currently be around 4.5%. At the other extreme, the policy rate prescribed by the nonemployment rate gap suggests that interest rates should remain at the zero lower bound for quite some time. The recommended policy rates from the other measures fall somewhere in the middle of this wide range.
Interpreting the divergence
The considerable divergence in recommended policy rates associated with alternative measures of unemployment means that policymakers must make judgments about the signal each measure is sending about current labor market slack. This judgment comes down to deciding whether the conflicting signals reflect (1) cyclical weakness that is only slowly working its way out of the economy, or (2) permanent structural factors that are relatively immune to monetary stimulus. (See Daly and Marks 2014 for a detailed discussion of cyclical versus structural factors.) This is harder than it might seem.
In support of the view that permanent structural factors are at work, researchers cite the fact that nearly half of the decline in labor force participation since 2007 can be attributed to the aging of the baby boomers (Council of Economic Advisers 2014). Moreover, after five years of recovery many young workers are still unemployed or have left the labor force altogether (Dennett and Modestino 2013). This could imply that the skills of many unemployed workers have depreciated over time or are mismatched with current job opportunities (Lacker 2014, Hornstein, Lubik, and Romero 2011). This view is consistent with the relatively quick recovery of the short-term unemployment rate relative to the long-term unemployment rate.
On the other side, researchers note that sluggish aggregate demand, rather than permanent damage to worker skills and employability, has limited the reabsorption of workers displaced during the recession. Under this view, the current state of the labor market is transitory, and a cyclical recovery is expected. This would include the long-term unemployed and marginally attached workers transitioning back into employment, as well as part-timers returning to full-time jobs (Cajner and Ratner 2014, Cajner et al. 2014, and Bengali, Daly, and Valletta 2013). This view is consistent with ongoing improvements in broader measures of unemployment—U4, U5, and U6.
In reality, the situation probably reflects a combination of cyclical and secular forces. This means that policymakers will need to rely on their own judgment more heavily than usual in making policy decisions. It also highlights that even simple rules do not give simple answers.
Conclusion
Determining whether the economy is near full employment is critical for achieving the Federal Reserve’s dual mandate. However, relying on a simple rule driven by a single labor market indicator has become more difficult since the Great Recession, which is why policymakers have made it clear that they will rely on a broad range of indicators when gauging labor market conditions. This Economic Letter has shown that when these indicators diverge, interpreting their varying signals requires considerable effort and judgment. This highlights one of the main challenges of monetary policy in the aftermath of the Great Recession.
Canyon Bosler is a research associate in the Economic Research Department of the Federal Reserve Bank of San Francisco.
Mary C. Daly is a senior vice president in the Economic Research Department of the Federal Reserve Bank of San Francisco.
Fernanda Nechio is an economist in the Economic Research Department of the Federal Reserve Bank of San Francisco.
References
Bengali, Leila, Mary Daly, and Rob Valletta. 2013. “Will Labor Force Participation Bounce Back?” FRBSF Economic Letter 2013-14 (May 13).
Bernanke, Ben. 2007. “Semiannual Monetary Policy Report to the Congress.” July 18.
Cajner, Tomaz, and David Ratner. 2014. “The Recent Decline in Long-Term Unemployment.” FEDS Notes.
Cajner, Tomaz, Dennis Mawhirter, Christopher Nekarda, and David Ratner. 2014. “Why Is Involuntary Part-Time Work Elevated?” FEDS Notes.
Council of Economic Advisers. 2014. “The Labor Force Participation Rate since 2007: Causes and Policy Implications.”
Daly, Mary C., and Elliot Marks. 2014. “The Labor Market in the Aftermath of the Great Recession.” Business Economics 49(3), pp. 149–155.
Dennett, Julia, and Alicia Sasser Modestino. 2013. “Uncertain Futures? Youth Attachment to the Labor Market in the United States and New England.” New England Public Policy Center Research Report 13(3), FRB Boston.
Elias, Early, Helen Irvin, and Òscar Jordà. 2014. “Monetary Policy When the Spyglass Is Smudged.” FRBSF Economic Letter 2014-35 (November 24).
Hornstein, Andreas, Thomas A. Lubik and Jessie Romero. 2011. “Potential Causes and Implications of the Rise in Long-Term Unemployment.” Economic Brief 11(09), FRB Richmond.
Lacker, Jeffrey M. 2014. “Investing in People as an Economic Growth Strategy.” Speech, Lynchburg, VA, June 26.
Taylor, John B. 1999. “The Robustness and Efficiency of Monetary Policy Rules as Guidelines for Interest Rate Setting by the European Central Bank.” Journal of Monetary Economics 43(3), pp. 655–679.
Yellen, Janet L. 2014. “Labor Market Dynamics and Monetary Policy.” Speech at the FRB Kansas City Economic Symposium, Jackson Hole, WY, August 22.
Opinions expressed in FRBSF Economic Letter do not necessarily reflect the views of the management of the Federal Reserve Bank of San Francisco or of the Board of Governors of the Federal Reserve System. This publication is edited by Anita Todd and Karen Barnes. Permission to reprint portions of articles or whole articles must be obtained in writing. Please send editorial comments and requests for reprint permission to research.library@sf.frb.org
