The Federal Reserve has purchased a large amount of longer-term bonds since December 2008. While these purchases have helped support a strengthening economy, the Fed’s resulting financial position may incur significant declines in bond values and net income when interest rates rise. However, analyzing a range of possible future interest rate scenarios—and their associated probabilities—shows that potential losses associated with these declines are very likely to be manageable.
Over the past six years, the Federal Reserve has provided additional monetary stimulus to spur economic growth and avoid price deflation by conducting several rounds of large-scale bond purchases—commonly known as quantitative easing. Through this program, the Fed has accrued a portfolio of longer-term securities several times larger than it was before the start of the financial crisis. This enormous size has prompted worries that the Fed could incur significant financial losses when interest rates rise. Indeed, the minutes of the December 2013 FOMC meeting noted “concerns about potential reputational risks to the Federal Reserve arising from any future capital losses.”
To assess the Fed’s portfolio risks, it is crucial to quantify them. Recent research by Carpenter et al. (2013) and Greenlaw et al. (2013) has generated detailed projections of the market value and cash flow of the Fed’s assets and liabilities under a few specific interest rate scenarios. Their projections are similar in spirit to the stress tests that large financial institutions conduct to gauge whether they have enough capital to endure adverse economic events. These projections do not place probabilities on the alternative interest rate scenarios but simply consider the repercussions of, say, shifting the level of the entire yield curve up or down from its baseline projection by a percentage point. Yet, the probability that a specific outcome will occur is also of great interest to policymakers. Attaching likelihoods to the alternative scenarios—or more generally, looking at the entire probability distribution of forecasts—results in what we term “probability-based” stress tests.
In this Economic Letter, we describe a probability-based stress test of the interest rate risk the Fed faces (see Christensen, Lopez, and Rudebusch 2013). Looking at projections of the U.S. Treasury yield curve, we assess the probabilities of key risk events, such as significant declines in the value of the Fed’s holdings of Treasury securities or in its income. We also consider how likely it is that these risky events would substantially reduce the Fed’s remittances to the Treasury. Using data through the end of 2012, we judge that adverse outcomes that could cause serious concerns for the Fed appear quite unlikely; this holds true using data through the end of 2013 as well (not shown). For example, there is only a remote chance that declines in Treasury bond prices could lead to mark-to-market losses on the Fed’s portfolio. Such low probabilities for these adverse outcomes should assuage concerns about the Fed’s portfolio holdings and income.
Two types of interest rate risk
In its quantitative easing program, the Fed has bought only Treasury securities and agency mortgage-backed securities (MBS) that carry a guarantee from the U.S. government. These securities are essentially free from credit risk. Still, their market value and the cost of funding (the carrying cost) will vary over time as interest rates change and represent two types of interest rate risk.
First, there is the balance sheet risk that increases in longer-term interest rates would erode the market value of the Fed’s portfolio. Such declines in market value would constitute unrealized capital losses that would only become realized if the securities were sold. Second, there is the income risk that increases in short-term interest rates would raise the rate that the Fed pays on bank reserves. Because the Fed’s interest income is generated from fixed coupon payments on longer-maturity securities, an increase in the amount it pays to banks for holding reserves would reduce the Fed’s net interest income and lower the Fed’s remittances to the U.S. Treasury—potentially all the way to zero.
The Fed’s balance sheet risk
The value of the Fed’s holdings of nominal Treasury securities increased markedly from $741 billion at the end of 2007 to almost $1.6 trillion by the end of 2012, when these securities accounted for nearly 60% of the Fed’s portfolio. We focus our analysis on these Treasury securities and examine the sensitivity of this portion of the Fed’s portfolio to interest rate fluctuations.
To generate the interest rate scenarios needed for our stress test, we use a model developed by Christensen and Rudebusch (2013). In addition to accurately capturing historical yield curve data, this model respects the constraint that nominal interest rates cannot go below zero, which is a key element of the current interest rate environment. Taking this zero lower bound into account allows us to generate the requisite, potentially asymmetric distribution of interest rate forecasts. For each of the alternative yield curves, we project the value of the Fed’s Treasury portfolio quarterly over the period from 2013 through 2015. The resulting distribution of possible portfolio outcomes allows us to generate probabilities for future risky events of interest.
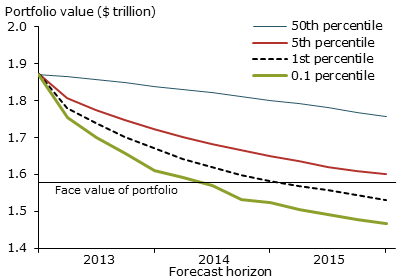
Figure 1
Projected market value of Fed’s Treasury securities

Figure 1 presents the lower half of the distribution of the value of the Fed’s Treasury portfolio over the forecast horizon. The thin blue line represents the median simulated portfolio value, which is expected to decline over time as bonds mature and as interest rates rise from their current historic lows. The future value of the Fed’s Treasury portfolio is equally likely to be above or below these median values. The remaining lines in the figure represent other percentiles from the simulated portfolio value distribution, which allow us to place probabilities on future events. For example, the likelihood that the Treasury portfolio’s value will fall below its face value and incur a financial loss by the end of 2015 is less than 5%. This analysis suggests that the Fed’s balance sheet risk for its Treasury holdings is quite low.
The Fed’s income risk
The Fed’s total portfolio of longer-term securities—its assets—are financed by bank reserves and currency—its liabilities; see Rudebusch (2011). The short-term interest rate that the Fed pays on bank reserves is largely the funding cost for that portfolio, which in turn generates a fixed-coupon stream of income. The Fed uses the resulting net interest income to pay for operating expenses and maintain capital, while the remainder is remitted to the U.S. Treasury. Therefore, the Fed faces the risk that a jump in short-term interest rates will cause its net interest income—and potentially its remittances to the Treasury—to fall.
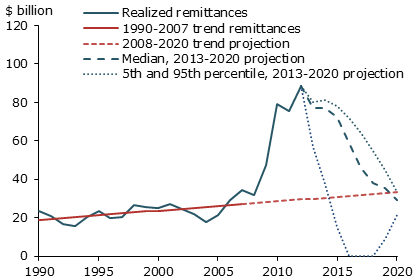
Figure 2
Actual and projected remittances to the U.S. Treasury

Our model-based interest rate scenarios can also be used to examine the probability that the Fed’s net interest income could fall by enough to eliminate its payments to the Treasury. Figure 2 shows the recent history of the Fed’s Treasury remittances, which is represented by the solid blue line through 2012, and future estimates based on our stress test. To gauge what payments to the Treasury might have been if the Fed had not conducted any quantitative easing, we show the fitted trend for remittances from 1990 through 2007 (solid red line) and an extrapolation of that trend through 2020 (dashed red line). Actual remittances were well above that extended trend from 2008 through 2012 due to the expanded size of the Fed’s balance sheet and very low short-term interest rates. However, as with the value of the Fed’s Treasury holdings, remittances are projected to decline as the Fed’s portfolio of bonds shrinks and interest rates rise. Still, the median projected value of the remittances remains well above the counterfactual non-QE trend through 2018.
To more closely examine the Fed’s income risk, we use the alternative interest rate scenarios to generate distributions of projected remittances year by year. The range of possible values from the lower 5th percentile to the upper 95th percentile is represented by the dotted blue lines. This range shows that there is only about a 5% chance that the Fed’s remittances could fall to zero during the three years from 2016 through 2018—an event that could raise some communications concerns for the Fed but no operational ones.
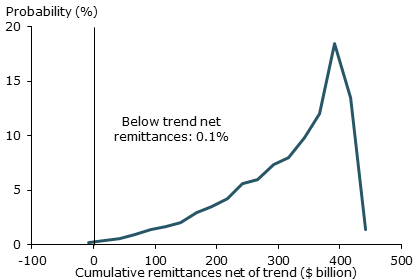
Figure 3
Distribution of cumulative remittances net of trend

To provide a better overall accounting of the income from the Fed’s quantitative easing program, Figure 3 presents our stress test’s projected distribution of cumulative remittances from 2008 through 2020, net of the projected trend discussed earlier. The overwhelming bulk of the distribution is positive; that is, the sum of annual remittances would almost certainly exceed the cumulative trend estimates. We calculate that the probability the Fed’s remittances net of trend over the forecast horizon would be negative is only 0.1%. This suggests that the cumulative effect of quantitative easing from a simple income perspective is likely quite positive.
Conclusion
The Fed’s portfolio of securities, which grew substantially as a monetary policy response to the slow economic recovery after the financial crisis, has raised concerns about interest rate risk. Of course, interest rate risk is a secondary consideration for central banks—subordinate to the macroeconomic goals of monetary policy (Rudebusch 2011). Still, prudent monitoring of such risk is needed, and a stress test of the Fed’s assets and income is an important component of that effort. Our analysis shows that the likelihood of significant losses on the Fed’s Treasury portfolio or a long cessation of Treasury remittances is very low.
Jens H.E. Christensen is a senior economist in the Economic Research Department of the Federal Reserve Bank of San Francisco.
Jose A. Lopez is a vice president in the Economic Research Department of the Federal Reserve Bank of San Francisco.
Glenn D. Rudebusch is director of economic research and executive vice president in the Economic Research Department of the Federal Reserve Bank of San Francisco.
References
Carpenter, Seth B., Jane E. Ihrig, Elizabeth C. Klee, Daniel W. Quinn, and Alexander H. Boote. 2013. “The Federal Reserve’s Balance Sheet and Earnings: A Primer and Projections.” Finance and Economics Discussion Series paper 2013-01, Federal Reserve Board.
Christensen, Jens H.E., Jose A. Lopez, and Glenn D. Rudebusch. 2013. “A Probability-Based Stress Test of Federal Reserve Assets and Income.” FRB San Francisco Working Paper 2013-38.
Christensen, Jens H.E., and Glenn D. Rudebusch. 2013. “Modeling Yields at the Zero Lower Bound: Are Shadow Rates the Solution?” FRB San Francisco Working Paper 2013-39.
Greenlaw, David, James D. Hamilton, Peter Hooper, and Frederic S. Mishkin. 2013. “Crunch Time: Fiscal Crises and the Role of Monetary Policy.” NBER Working Paper 19297.
Rudebusch, Glenn D. 2011. “The Fed’s Interest Rate Risk.” FRBSF Economic Letter 2011-11 (April 11).
Opinions expressed in FRBSF Economic Letter do not necessarily reflect the views of the management of the Federal Reserve Bank of San Francisco or of the Board of Governors of the Federal Reserve System. This publication is edited by Anita Todd and Karen Barnes. Permission to reprint portions of articles or whole articles must be obtained in writing. Please send editorial comments and requests for reprint permission to research.library@sf.frb.org