Forecasts of short-term interest rates that are based on futures rates in financial markets can be very misleading when the policy rate is near the zero lower bound. By contrast, options on future short-term interest rates can provide more accurate projections. Currently these options suggest that the federal funds rate—the Federal Reserve’s key monetary policy interest rate—is most likely to lift off from zero around mid-2015 and rise only slowly afterwards at a pace of about 1 percentage point per year.
During “normal” times for monetary policy, the short-term interest rate is the main policy instrument, and it is a comfortable distance away from zero. In this situation, it is fairly straightforward to see what financial market investors expect the central bank to do in the near future. In particular, rates on money market futures and forward rates for government bonds reflect investors’ expectations for the future path of short-term rates. Hence, anyone interested in the market’s view of future monetary policy can calculate it simply from observed interest rates.
However, we are not in normal times. Short-term interest rates, including the federal funds rate—the policy rate targeted by the Federal Reserve—have remained at essentially zero since December 2008. The current situation in which short rates are fixed close to zero is referred to as the “zero lower bound” because interest rates, with some rare exceptions, cannot turn negative. At the zero lower bound, the commonly used futures or forward rates are of limited use for gauging the market’s view of future policy rates. The reason they can be misleading is that they do not reflect the most likely future path for the short-term interest rate.
Prices of options on future short-term interest rates can provide the necessary information to estimate what the market expects as the most likely path for short rates. This Economic Letter explains what we can learn from the prices of these options. I provide estimates of where the market currently thinks monetary policy is headed in the near future, according to the probability distributions for future short rates. From this, we can infer the most likely future path of the policy rate—including the most likely timing of the first rate hike, or “liftoff.”
Probability distributions for future short-term rates
An option contract gives the owner the right, but not the obligation, to buy or sell an underlying asset at a future point in time, called the “expiration date,” at a predetermined price, called the “strike price.” Options are available for a variety of underlying instruments. In this Letter, I focus on Eurodollar options because they are available for a wide range of expiration dates and the contracts are very liquid. For these options, the underlying security is a Eurodollar futures contract. Since the payoff of these futures is tied to the three-month London interbank offered rate (Libor)—one of the world’s leading short-term interest rate benchmarks—Eurodollar options are, in effect, bets on the future value of Libor. While the federal funds rate differs from Libor, the difference between these two short rates is typically small, about 0.15 percentage point, and quite stable. Therefore, prices of Eurodollar options are quite informative about investors’ views of the future federal funds rate.
Using prices for Eurodollar option contracts with the same expiration date but different strike prices, we can infer the market’s opinion of the probability distribution of the future short-term interest rate, that is, the entire range of likely future rates. In related work, Bauer and Christensen (2014) have derived estimates of the market’s view on future inflation using a similar method. These distributions correspond to so-called risk-neutral probabilities. While they are not the same as real-world probability distributions, because they put more weight on outcomes that investors worry about and want to hedge against, there are good reasons to use them for policy analysis. First, policymakers, just like investors, are worried about adverse outcomes (Kocherlakota 2013). Second, at relatively short forecast horizons, the difference between real-world and risk-neutral distributions—the term premium—is likely to be quite small. Last, but certainly not least, the option-based method simply summarizes information from market prices and does not depend on any model or impose any restrictive assumptions.
Figure 1
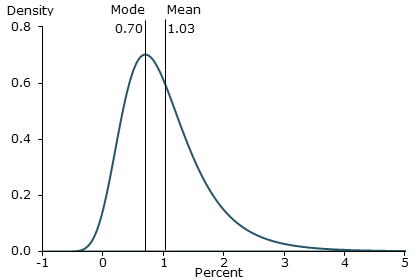
Probability density for Libor short rate, December 2015

Figure 1 displays the option-based distribution for the Libor short rate in December 2015, represented by a probability density curve using market data from September 8, 2014. Areas under the curve for a certain interval correspond to the probability of the future short rate being within that range. The curve displays the pronounced asymmetry of the distribution: It shows that the probability of the short rate falling negative is basically zero, reflecting the fact that the short rate can only remain near zero or rise.
The statistical expectation for this distribution, the mean, reflects what investors expect for the future short rate on average. In this case the mean of the distribution is 1.03%. It is identical to the rate on a Eurodollar futures contract with the same expiration date, since this also tells us the mean future short rate. The most likely future value of the short rate, the mode, is where the density reaches its highest point. The market data point to 0.70% as the most likely short rate for December 2015. During normal times, when the distribution of future short rates is more symmetric, indicating that the rate has a roughly equal chance of falling or rising, the mean and the mode of this distribution would be nearly identical. In contrast, due to the asymmetry at the zero lower bound, there currently is a significant wedge between the mean and the mode.
Consequently, market data at the zero lower bound must be interpreted carefully (see Bauer and Rudebusch 2013 for further discussion). Taking observed futures rates at face value to estimate the market’s view for monetary policy can be misleading in that they reflect the average rate. To avoid distortion from the asymmetrical distribution caused by the zero lower bound, it is preferable to use options data and to consider the mode of the future short rate, because it reflects the most likely path of policy.
Figure 2
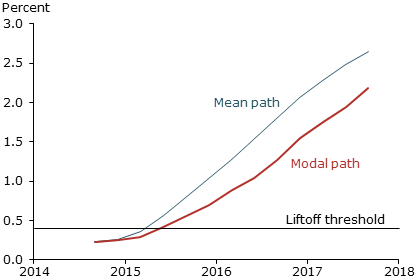
Market view of paths for future Libor short rates

Current expectations for future policy rates
To understand the market’s current view about future monetary policy, it’s natural to look beyond the prediction for one specific future date and instead consider the entire future path of short-term rates. Eurodollar option contracts are traded with quarterly expiration dates out to several years, which provide the information necessary to estimate such a future policy path. For each expiration date through September 2017, I calculate the mean and the mode of the associated probability distribution. Figure 2 shows the resulting mean (average) and modal (most likely) paths for the most recent market data.
The mean path starts at the same value as the modal path, around 0.25%, but then rises earlier and more steeply. The resulting gap between the mean and modal paths measures about 0.5 percentage point for expiration dates in 2016 and 2017, which reflects the asymmetry of the distribution of future short rates.
What is the market’s expectation for the date of policy liftoff? Since the Fed’s current target range for the federal funds rate is 0 to 0.25%, liftoff can be measured as the first time the funds rate exceeds 0.25%. Accounting for the 0.15 percentage point spread between the Libor and the fed funds rate, in this study liftoff could be measured as the first time Libor exceeds 0.4%, shown as a horizontal line in Figure 2. Current market data imply liftoff seems most likely to occur during the second quarter of 2015.
For the end of 2015, the market sees the most likely value for Libor as 0.70%. Adjusting for the spread between rates yields a fed funds rate of 0.55%. For the end of 2016, the modal estimate for Libor is 1.55%, which implies a funds rate of 1.40%. The pace of policy tightening implied by these estimates suggests that the markets expect the policy rate to increase approximately 1 percentage point per year. From a historical perspective, this is a relatively slow pace. For example, between June 2004 and June 2006, the Fed increased the funds rate by 4 percentage points—a pace of 2 percentage points per year, which is similar to previous episodes of policy tightening. One may also compare market-based estimates of the policy rate’s path to the Federal Open Market Committee’s Survey of Economic Projections, which indicates that the market appears to expect a lower and more gradual path for future short rates than FOMC participants (see Christensen and Kwan 2014).
Figure 3
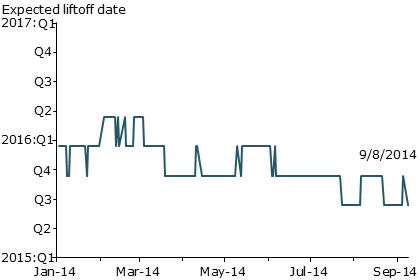
Market expectation for date of future policy liftoff

Liftoff—the timing of the first rate hike
One important dimension of monetary policy expectations at the zero lower bound is the expected timing of policy liftoff. How has the market’s expectation for this evolved over time? Figure 3 displays estimates of future policy liftoff for each trading day in 2014, up to September 8. The market entered 2014 expecting that the policy rate would lift off sometime around the fourth quarter of 2015. Early in the year, this horizon was lengthened to the first quarter of 2016. At that time, public discussion centered on predictions that inflation would remain persistently below the Fed’s 2% target, prompting speculation of a longer period of near-zero policy rates. The estimated liftoff shortened in March to the third quarter of 2015 following the remarks about the possible timing of liftoff by Fed Chair Janet Yellen during her post-FOMC meeting press conference. More recently, the expected liftoff has moved even earlier to the second quarter of 2015, likely due to both communication by FOMC participants and positive economic data.
How do these option-based liftoff expectations compare with alternative estimates? One important estimate comes from surveys of professional forecasters and market participants, such as the New York Fed’s Survey of Primary Dealers. In early 2014, the respondents on average viewed the fourth quarter of 2015 as the most likely liftoff date. Since then, these expectations have moved a bit earlier, and for most of the year, they have estimated liftoff for the third quarter of 2015. Overall, the survey-based estimates are in line with the option-based estimates.
Conclusion
Prices of options on future short-term interest rates provide a valuable alternative source of information about market expectations for future monetary policy. With the policy rate at the zero lower bound, one should not rely solely on information in futures or forward rates. These reflect average future rates, which in this situation can differ substantially from the more relevant modal or most likely future rates. Option-based estimates of the most likely policy path indicate that market participants expect liftoff to occur around the middle of 2015, and further expect the subsequent policy tightening to be gradual.
Michael Bauer is an economist in the Economic Research Department of the Federal Reserve Bank of San Francisco.
References
Bauer, Michael D., and Jens H.E. Christensen. 2014. “Financial Market Outlook for Inflation.” FRBSF Economic Letter 2014-14 (May 12).
Bauer, Michael D., and Glenn D. Rudebusch. 2013. “Expectations for Monetary Policy Liftoff.” FRBSF Economic Letter 2013-34 (November 18).
Bauer, Michael D., and Glenn D. Rudebusch. 2014. “Monetary Policy Expectations at the Zero Lower Bound.” FRB San Francisco Working Paper 2013-18.
Christensen, Jens H.E., and Simon Kwan. 2014. “Assessing Expectations of Monetary Policy.” FRBSF Economic Letter 2014-27 (September 8).
Kocherlakota, Narayana. 2013. “Optimal Outlooks.” Speech at the Conference on Extracting and Understanding the Risk Neutral Probability Density from Options Prices, NYU Stern School of Business, New York, September 20.
Opinions expressed in FRBSF Economic Letter do not necessarily reflect the views of the management of the Federal Reserve Bank of San Francisco or of the Board of Governors of the Federal Reserve System. This publication is edited by Anita Todd and Karen Barnes. Permission to reprint portions of articles or whole articles must be obtained in writing. Please send editorial comments and requests for reprint permission to research.library@sf.frb.org