Animal spirits are often suggested as a cause of business cycles, but they are very difficult to define. Recent research proposes a novel explanation based on the changing level of risk over time and people’s uncertainty about how the world works. The interaction of these two can lead to significant business cycle fluctuations in response to spikes in volatility. This finding gives researchers an alternative to irrational behavior as an explanation for why swings in consumer sentiment appear to drive the business cycle.
What causes economic fluctuations? The economy is buffeted by many factors, such as technological advances, commodity price changes, and policy stimulus. But a long-running tradition attributes part of the ups and downs in the business cycle to changes in consumer sentiment, or “animal spirits.” Researchers have considered many approaches to explaining this nebulous concept. In this Economic Letter I discuss a novel strategy in Bidder and Smith (2012) that shows how changes in the variability of the economy, combined with the uncertainty people have over how the world works, can generate a phenomenon like animal spirits and, thus, drive business cycles.
Risk and uncertainty
Risk is an inevitable fact of life. People make economic decisions without perfect foresight of how the future will unfold. However, pinning down a single set of probabilities for random events allows people to make decisions according to their tolerance for risk and what the decisions will imply as events unfold. It is now standard in economics to imagine that people, businesses, and governments use some sort of economic model to determine these probabilities.
One assumption implicit in this approach is that people trust their models. In other words, they fully believe that the probabilities it assigns to certain events are correct. However, this assumption could be flawed. People could conceivably be concerned that their models are wrong. Importantly, a model may be wrong in ways people cannot even articulate, sometimes referred to as the problem of “unknown unknowns.” In such situations, people face not only the risk of random events occurring with known probabilities, but also the uncertainty of random events occurring with unknown probabilities.
Robust control
Formalizing how people behave when they doubt their model of how the world works is a difficult challenge. Nevertheless, two Nobel laureates—Lars Hansen and Thomas Sargent (2008)—have made considerable progress using an approach called “robust control.” According to their theory, people have a “benchmark” model in mind. However, they fear it is incorrect and so imagine other sets of probabilities that are close to the benchmark probabilities. These alternative models implicitly capture misspecifications in the benchmark. The reason for staying close to the benchmark is that, even though it might be wrong, it is still considered a reasonable description of the world. So, alternative models must be somewhat like the benchmark to be considered plausible.
Faced with such uncertainty, how do people make decisions? Robust control implies that people try to limit their downside. This tendency to hope for the best but plan for the worst has intuitive appeal. By planning for painful, yet plausible, misspecifications in the benchmark, a person makes decisions that will be robust to the model being wrong. Balancing pain and plausibility in this way leads the person to identify a particular “worst-case” model. To reduce the downside, the person then behaves as if this model, rather than the benchmark, is actually at play.
Since the worst-case model differs from the benchmark model, the person will react differently from someone who fully trusts the benchmark. Importantly, if researchers and economic commentators don’t allow for this type of uncertainty then people’s behavior might seem to be the result of irrational urges. This is the phenomenon that Bidder and Smith (2012) explore. They show that a form of animal spirits can arise from rational behavior when uncertainty clouds what is otherwise a fairly standard view of the economy.
Modeling framework
Bidder and Smith’s framework is novel but also contains many features that are common in thinking about how economies work. Households earn wages by working for businesses and decide how much to save or consume of their income. Businesses produce goods to be bought by households and invest in the economy’s capital stock. The economy grows through capital accumulation and improvements in technology. In any given period, GDP is determined by the capital stock, capacity utilization, labor supply, and the technology level.
Research has documented that the riskiness of the economy varies over time (see Justiniano and Primiceri 2008 and Fernandez-Villaverde et al. 2010). This is a prominent feature in discussions of the Great Recession. Building on this evidence of time-varying risk, Bidder and Smith allow changes in technology levels to be more volatile in some periods than in others.
Most important in Bidder and Smith’s model of the economy is the fact that households fear their benchmark model is wrong. In fact, the world that Bidder and Smith set up actually does follow the benchmark, so people’s fears are only in their heads. Nevertheless, people behave as if the world is driven by the worst-case model.
Robustness as a source of animal spirits
What are the properties of the worst-case model? Since growth is good and volatility is bad, the worst-case model features lower growth and larger fluctuations than the benchmark, capturing a pessimistic view of the world. For this to fit the animal spirits story, this pessimism must vary with the level of volatility and so give the impression of variations in sentiment. When volatility is high, people’s pessimism is more intense. When volatility is low, it is muted.
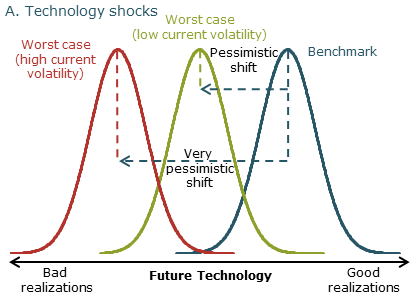
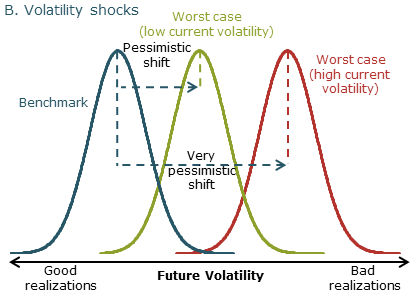
Figure 1 captures this idea using stylized bell curves. The curves in panel A illustrate the relative likelihood of random changes in future technology. The curves in panel B show the likelihood of changes in future volatility. The horizontal axis for each shows how big the changes are, and the area under a curve between any two points shows the relative probability.
Figure 1
Probabilities of future shocks


The blue curves are what the benchmark model tells people to think. They do not vary over time. If people trusted their benchmark, these probabilities would drive their behavior. The red and green lines represent what the worst-case model tells people to guard against. They vary over time depending on the current level of volatility—the red curve applies when volatility is high and the green curve applies when volatility is low. When people fear that their view of the world may be wrong, they behave as if driven by these probabilities.
Relative to the blue lines, the shifts to the left in the technology panel and to the right in the volatility panel capture the pessimism discussed earlier. Lower-than-expected technology induces lower growth, and higher-than-expected volatility implies a less stable economy. The greater shift in the red lines shows that pessimism is more intense when the economy is more risky.
While I have emphasized the pessimism gap between the worst-case model and the benchmark, periods of relatively low pessimism can also be thought of as periods of relatively positive sentiment. This is in line with standard ways of expressing confidence, as in the Conference Board’s Consumer Confidence Index, for example. The level of the series matters less than its fluctuations. It is the variations in worst-case probabilities that can be thought of as animal spirits.
Animal spirits and business cycles
The fact that people are subject to animal spirits is not the end of the story. These fluctuations in sentiment underlie behavior that leads to business cycles after unexpected shifts in volatility. The reason for this can be inferred from Figure 1. If people doubt their model, a spike in volatility has a larger effect than if they fully trust the model because they are informed by the red curves rather than the green. If they fully trusted their model, this effect would be absent because they would always have the blue curves in mind, so their response would be relatively muted.
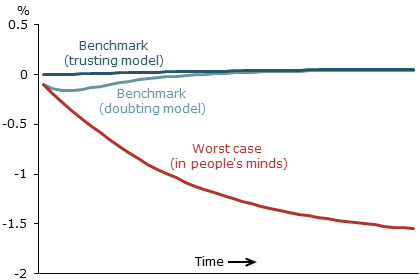
To explore how this shift in sentiment can ultimately affect the economy, I illustrate different paths output might take following a spike in volatility in Figure 2. Two of the responses are under benchmark models that are identical except for people’s confidence in their model. The dark blue line is the expected response of output when people fully trust the benchmark model, and the economy does in fact follow the benchmark. In this case, the response to a volatility shock is muted and barely visible. In contrast, the light blue line shows how an economy that follows the benchmark model is affected when people are subject to the animal spirits in Bidder and Smith’s model.
Figure 2
Response of output to spike in volatility

If people mistakenly believe the economy will follow their worst-case model, which implies an expected response shown by the red line, their doubts will amplify the effects of the volatility shock through the decisions they make. Worrying about a worst-case model that implies a severe expected contraction, people immediately cut consumption. This reflects the interaction of the traditional consumption smoothing motive with a pessimistic view of the world. This pessimism also leads businesses to operate and invest at a lower intensity. This reduces productivity and, therefore, wages, which in turn contributes to a decline in hours worked. In this way, the worst-case fears would lead to an actual drop in output, as shown in the light blue line.
These comovements of important macroeconomic variables fit our intuition of how higher volatility affects the economy, causing a general contraction in activity. After some time passes and volatility drops to a more normal level, people become more confident. Animal spirits are tamed, and the economy returns to normal.
The situation would reverse following a decline in volatility. Thus, in addition to explaining why one might observe a downturn in economic activity after a spike in volatility, Bidder and Smith’s model might also provide a way to interpret buoyant economic activity during the period of low volatility commonly referred to as the Great Moderation.
Bidder and Smith show how volatility-induced movements can lead to significant fluctuations in the economy. These business cycles would be inexplicable if researchers ignored the possibility that people doubt their own models—they would expect to see the minimal effects captured in the dark blue line. That is, without allowing for a fear of model misspecification one would have to explain the apparent decline in effective demand underpinning the light blue line via some ad hoc irrationality. Instead, Bidder and Smith offer as a plausible explanation their particular formulation of animal spirits, grounded in the rational theory of behavior under uncertainty that is robust control.
Conclusions
This Letter proposes a partial explanation for business cycles based on the interaction of time-varying volatility and people’s doubts about their model of the world. The interaction of volatility and uncertainty leads to a phenomenon that could be interpreted as animal spirits, a concept that has a long history in economics and which rationalizes the common belief that fluctuations in sentiment are important drivers of the economy.
Rhys Bidder is an economist in the Economic Research Department of the Federal Reserve Bank of San Francisco.
References
Bidder, Rhys M., and Matthew E. Smith. 2012. “Robust Animal Spirits.” Journal of Monetary Economics 59(8), pp. 738–750.
Fernandez-Villaverde, Jesus, Pablo Guerron-Quintana, and Juan F. Rubio-Ramirez, 2010. “Fortune or Virtue: Time-Variant Volatilities versus Parameter Drifting in U.S. Data.” NBER Working Paper 15928.
Hansen, Lars P., and Thomas J. Sargent. 2008. Robustness. Princeton, NJ: Princeton University Press.
Justiniano, Alejandro, and Giorgio E. Primiceri. 2008. “The Time-Varying Volatility of Macroeconomic Fluctuations.” American Economic Review 98(3), pp. 604–641.
Opinions expressed in FRBSF Economic Letter do not necessarily reflect the views of the management of the Federal Reserve Bank of San Francisco or of the Board of Governors of the Federal Reserve System. This publication is edited by Anita Todd and Karen Barnes. Permission to reprint portions of articles or whole articles must be obtained in writing. Please send editorial comments and requests for reprint permission to research.library@sf.frb.org