Persistently low price inflation, falling energy prices, and a strengthening dollar have helped push down market-based measures of long-term inflation compensation over the past two years. The decline in inflation compensation could reflect a lower appetite for risk among investors or decreased market liquidity. A third alternative supported by recent research suggests that the decline reflects lower long-term inflation expectations among investors. Projections indicate the underlying expectations will revert back to typical long-run levels only slowly.
The Federal Reserve is charged with a dual mandate of achieving maximum employment and price stability. While employment has grown rapidly in recent years, price inflation has remained below the Fed’s stated goal of 2% annually. Policymakers have expressed confidence that inflation will return to its target in part because long-term inflation expectations reported in surveys of households and professional forecasters have remained close to that target during the recovery. In a speech last year, Fed Chair Janet Yellen (2015) described the crucial role of these expectations as a determinant of future inflation. In her remarks, Yellen noted that survey-based measures of long-term inflation expectations were steady around 2% and that inflation is likely to return to its well-anchored target once the economy returned to full employment.
In contrast, market-based measures of long-term inflation expectations have been less stable. These measures of long-term inflation compensation reflect investors’ underlying long-term expectations as well as premiums for risk and market liquidity. Market-based measures have trended down over the past two years to about 1.6%. In this Letter, we estimate how much of this decline represents a downshift in long-term inflation expectations and how much reflects other factors. We use recent research by Christensen, Lopez, and Rudebusch (forthcoming, henceforth CLR) to correct for risk premiums and liquidity effects that can skew market-based measures. Our results suggest that long-term inflation expectations among financial market participants have in fact shifted down over the past two years. Furthermore, using a probability-based approach advocated by Christensen, Lopez, and Rudebusch (2015) to assess the outlook for investors’ long-term inflation expectations, we find that these expectations will take some time to revert back to target. However, given the model uncertainty involved in our analysis, exactly how long that will take remains an open question.
Measures of long-term inflation expectations
Monetary policy makers carefully monitor long-term inflation expectations to assess whether households and businesses view changes in inflation as permanent or transitory. One such market-based measure is breakeven inflation (BEI), which is the difference between the yield on a regular Treasury bond and that on a Treasury inflation-protected security (TIPS), each with the same maturity. TIPS principal and interest payments are indexed to changes in the consumer price index (CPI) to protect the real value of their returns. Therefore, BEI is the implied rate of CPI inflation that makes the return on investment for these two bonds equal.
Figure 1 shows BEI rates for five-year periods starting five years from the respective dates in the figure (blue line), which are commonly referred to as five-year-forward five-year-ahead (5-year-5) rates. These rates are frequently used to measure long-term inflation expectations because, by construction, investors who take a long position in this contract have greatly reduced exposure to any inflation shocks over the next five years. As a consequence, 5-year-5 rates represent financial market participants’ views about persistent trends in CPI inflation. The series is relatively stable for most of the period since 2005, but it has trended markedly lower since 2014. This change is in sharp contrast to the corresponding long-term inflation forecasts imputed from the quarterly Survey of Professional Forecasters (SPF, red line), which have varied much less and remained fairly stable during the whole period. In fact, the long-term inflation expectations reflected in financial markets have never been as far below those implied by the SPF as in recent months.
Figure 1
Long-term inflation expectation measures, 2005 to March 2016
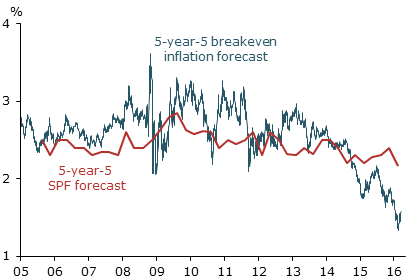
Note: Long-term expectations reflect five-year periods starting five years ahead of each forecast date.
However, these market-based measures cannot be taken simply at face value, as Bauer and Rudebusch (2015) note. First, they are biased by time-varying inflation risk premiums that risk-averse investors demand in return for holding nominal securities. According to our model results detailed below, these premiums account for most of the mainly positive differences relative to the SPF before 2014. Second, BEI rates may be distorted by limits to arbitrage and liquidity issues in the markets for TIPS, whose total value is less than one-tenth the size of the market for regular Treasury securities. To better gauge the inflation expectations implied by these securities, we use the model-based approach proposed by CLR to correct the breakeven rates for both inflation risk premiums and liquidity effects.
A model of breakeven inflation adjusted for liquidity
To extract investors’ inflation expectations from BEI rates, we use the term structure model introduced in CLR, which captures the joint dynamics of nominal and real Treasury yields to remove inflation risk premiums. To then account more directly for the liquidity premiums in TIPS bond prices, we adjust these model-based inflation expectations using an approach that accounts for the effect of liquidity on the deflation option embedded in TIPS bonds. This option pays off if net inflation over the bond’s life is negative and ensures that, at a minimum, the TIPS bond pays back its original principal. We measure the value of this option at-the-money as the yield spread between two comparable synthetic TIPS: one seasoned, and the other newly issued, each with five years to maturity. The value of the deflation option within the seasoned TIPS is assumed to be zero since cumulative inflation over this period has been positive and deflation is not possible. The deflation option within the newly issued TIPS has no accrued inflation experience at all and thus has a positive value. Hence, the yield spread between these two TIPS represents a measure of the value of the at-the-money deflation option.
To control for the effects of TIPS market liquidity, we regress the deflation option value measure on four explanatory variables. The first is the VIX, which represents near-term uncertainty about the general stock market as reflected in one-month options on the Standard & Poor’s 500 stock price index. Thus, the VIX is a measure of priced economic uncertainty that should correlate with the fundamental value of deflation options. The remaining three variables are used to control for the TIPS market’s limits to arbitrage and other pricing factors. Those are the Treasury market illiquidity measure introduced by Hu, Pan, and Wang (2013), the spread between seasoned and recently issued comparable Treasury securities, and weekly average trading volume in the secondary market for TIPS as reported by the Federal Reserve Bank of New York.
Based on the regression result, we consider the VIX multiplied by its estimated regression coefficient to be a reasonable estimate of the true deflation option value for the newly issued TIPS adjusted for liquidity effects. Since we assume that only TIPS yields suffer from liquidity effects, we use this adjusted option value to determine the alternative TIPS yields that would be needed to generate them. In turn, we use these liquidity-adjusted TIPS yields to create our liquidity-adjusted inflation forecasts at all relevant horizons. As the CLR model is structured to avoid any arbitrage opportunities, this final step also adjusts the forecasts for any embedded inflation risk premiums.
Recent measures of inflation expectations
The model’s projections for average expected inflation over the following 10 years with and without liquidity adjustment are shown in Figure 2 for February 7, 2014 (red lines), and March 18, 2016 (black lines). Also shown are the closest available SPF forecasts dated February 10, 2014, and February 12, 2016, respectively. First, we note that adjusting for TIPS illiquidity does provide a meaningful upward push to these measures of inflation expectations, as indicated by the solid lines. In fact, the liquidity-adjusted inflation forecasts for February 2014 (red solid) are relatively close to the corresponding SPF inflation forecasts. However, by March 2016, the model’s estimated five- and ten-year expected average inflation fell by 0.94% and 0.88%, respectively, as shown by the differences between the red and black dots. The corresponding SPF forecasts of average annual inflation declined by only 0.02% and 0.18%, respectively, as shown in the differences between the levels of the red and black Xs.
Figure 2
Projections of average annual CPI inflation
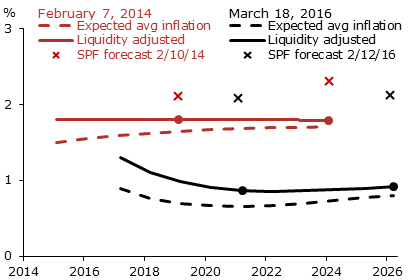
Note: Lines show model results for expected average inflation with no adjustment (dashed) and adjusted for liquidity (solid), along with the SPF inflation forecasts closest to the respective dates.
As a consequence, a pronounced wedge has developed between these survey-based and market-based estimates of long-term inflation expectations. As of March 18, 2016, the differences of 1.21% for five-year and 1.20%, for ten-year expectations, are well above the historical average differences of 0.58% and 0.57%, respectively. These results suggest that there is currently an important degree of dispersion in the long-term inflation outlook across these two groups. According to the SPF, 10-year inflation expectations are approaching 2.1%, while our analysis suggests that bond investors expect inflation to average only about 0.9% over the next 10 years.
An advantage of using a dynamic yield curve model for our analysis is that we can make additional projections. We follow Christensen et al. (2015) and assess the probabilities for investors’ long-term inflation expectations. Using the CLR model, we project 10,000 possible paths for the model factors, which allows us to forecast the probability of various outcomes for investors’ inflation expectations at different horizons. In Figure 3, the dashed line shows the median and the dotted lines show the range of projections excluding the top and bottom 2.5 percentiles for inflation over a five-year period starting five years ahead as of March 18, 2016.
Figure 3
Projections of long-term inflation expectations
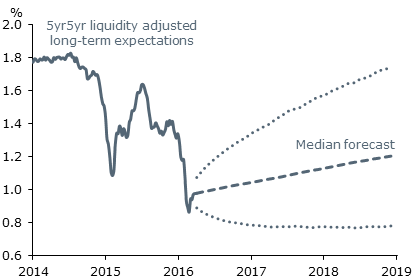
Note: Forecasts show five-year period beginning five years ahead of the date; dashed line reflects the median forecast, with dotted lines showing the 95% confidence range for that forecast.
The median projection slopes upward but only reaches 1.2% by the end of 2018. To evaluate the projections of long-term inflation expectations, a useful benchmark is 1.8% at the start of 2014, since that was the level before the recent energy price declines and U.S. dollar appreciation. The results show that, as of March 2016, there was less than a 5% chance of investors’ long-term inflation expectations reverting back to that level before 2019. Hence, it appears that the pressures pushing down inflation since early 2014 have had a lasting negative effect on investors’ long-term expectations, which is projected to only partially be undone over the next few years. In interpreting these results, however, it is important to keep in mind the notable model uncertainty inherent in such projections. Furthermore, since market-based measures can reflect supply and demand imbalances in global financial markets unrelated to U.S. inflation, it is unclear how much of the decline represents changing inflation expectations among U.S. households and firms that presumably matter the most for future inflation.
Conclusion
The recent significant declines in market-based measures of inflation expectations stand out in comparison to the more stable measures reflected in survey evidence. In this Letter, we analyze the recent decline in market-based measures using a model that adjusts for both liquidity effects and risk premiums in the TIPS market. The model results suggest that the decline cannot be attributed solely to these two factors. Thus, absent other factors not accounted for in our model, a substantial portion of the decline in these measures reflects a notable downward shift in investors’ medium- and long-term inflation expectations. We calculate that this decline is not likely to be short-lived, but should be resolved over the medium- to long-term. In contrast, the long-term inflation expectations reflected in surveys of professional forecasters have declined much less. The underlying reasons for this disparity are not immediately clear and require additional analysis.
Jens H.E. Christensen is a research advisor in the Economic Research Department of the Federal Reserve Bank of San Francisco.
Jose A. Lopez is a vice president in the Economic Research Department of the Federal Reserve Bank of San Francisco.
References
Bauer, Michael D., and Glenn D. Rudebusch. 2015. “Optimal Policy and Market-Based Expectations.” FRBSF Economic Letter 2015-12 (April 13).
Christensen, Jens H.E., Jose A. Lopez, and Glenn D. Rudebusch. Forthcoming. “Pricing Deflation Risk with U.S. Treasury Yields.” Forthcoming in Review of Finance.
Christensen, Jens H.E., Jose A. Lopez, and Glenn D. Rudebusch. 2015. “A Probability-Based Stress Test of Federal Reserve Assets and Income.” Journal of Monetary Economics 73, pp. 26–43.
Hu, Grace X., Jun Pan, and Jiang Wang. 2013. “Noise as Information for Illiquidity.” Journal of Finance 68(6), pp. 2,341–2,382.
Yellen, Janet. 2015. “Inflation Dynamics and Monetary Policy.” Speech at the Philip Gamble Memorial Lecture, University of Massachusetts, Amherst, (September 24).
Opinions expressed in FRBSF Economic Letter do not necessarily reflect the views of the management of the Federal Reserve Bank of San Francisco or of the Board of Governors of the Federal Reserve System. This publication is edited by Anita Todd and Karen Barnes. Permission to reprint portions of articles or whole articles must be obtained in writing. Please send editorial comments and requests for reprint permission to research.library@sf.frb.org