The “natural” rate of interest—the real rate consistent with full use of economic resources and steady inflation near the Fed’s target level—is an important benchmark for monetary policy. Current estimates suggest that this rate is near zero, but it is expected to rise gradually in the years ahead as real GDP returns to its long-run potential. If the historical statistical relationship between the growth rate of potential GDP and the natural rate holds true in the future, then a 2% long-run growth rate would imply a long-run natural rate of around 1%.
The “natural” rate of interest, also known as r* (r-star), is the inflation-adjusted interest rate that is consistent with full use of economic resources and steady inflation near the Fed’s target level. The natural rate is an important benchmark for monetary policy because it determines the real interest rate that policymakers should aim for once temporary shocks to the economy have dissipated and the Fed’s macroeconomic targets have been achieved (Hamilton et al. 2015).
Over the past three decades, empirical estimates of r-star track reasonably well with the four-quarter growth rate of potential GDP, as estimated by the U.S. Congressional Budget Office (CBO 2016). The CBO currently projects potential GDP to the year 2026. This Economic Letter uses the historical statistical relationship between the growth rate of CBO’s potential GDP series and estimates of r-star to construct a 10-year projection for the natural rate. The exercise suggests a very gradual rise in r-star from a value near zero in early 2016 to a long-run value of around 1% in 2026. This long-run projected value is slightly below the central tendency midpoint for the longer-run real federal funds rate from the June 2016 Summary of Economic Projections (SEP) issued by the Federal Open Market Committee (FOMC).
Empirical estimates of r-star
Standard economic models imply that r-star is linked to households’ degree of patience, which influences their choice of saving versus current consumption, and to the expected growth rate of potential GDP, which influences the rate of return from savings. However, these two factors are not directly observable. This means that the value of r-star must be inferred using data on economic variables that can be observed, such as nominal interest rates, inflation, and real GDP growth.
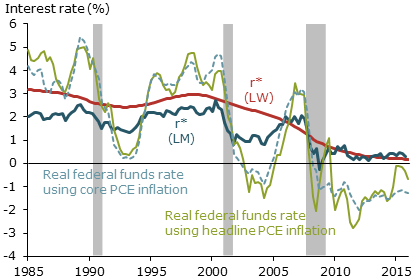
Figure 1 plots estimated time series for r-star from two recent studies that employ different statistical methods. The r-star series from Laubach and Williams (2015, updated) is the red line denoted by LW, while that from Lubik and Matthes (2015, updated) is the dark blue line denoted by LM. Given the considerable uncertainty surrounding estimates of r-star, any observed differences between the two series are not statistically significant. Since r-star is adjusted for inflation, Figure 1 plots for comparison the inflation-adjusted, or “real,” federal funds rate, computed as the nominal federal funds rate minus the trailing four-quarter personal consumption expenditures (PCE) inflation rate, using both the headline measure and the core measure that removes volatile food and energy components. All of the series exhibit downward-sloping trends. This pattern is consistent with the declines in global real interest rates observed over the same period (International Monetary Fund 2014, Rachel and Smith 2015).
Figure 1
Real interest rates, 1985:Q1 to 2016:Q1

Note: Shaded areas indicate recessions.
Estimates of r-star are an important input for monetary policy decisions. Setting the real federal funds rate too high relative to r-star for an extended period could contribute to an undershooting of the central bank’s inflation target or cause real GDP growth to fall below potential growth. Setting the real federal funds rate too low relative to r-star for an extended period could contribute to an overshooting of the inflation target or to a buildup of financial imbalances that would make the economy more vulnerable to a crisis or severe recession if the imbalances unwind.
Figure 1 shows that the real federal funds rate remained consistently below r-star during the five-year period from the first quarter of 2001 through the first quarter of 2006. Some have argued that this period of “loose” monetary policy contributed to excessive run-ups in U.S. house prices and mortgage debt that subsequently reversed and triggered a severe crisis and recession (Taylor 2007 and Selgin, Beckworth, and Bahadir 2015). Others argue that low interest rates were not a major contributor to the U.S. housing boom (Dokko et al. 2011). Much evidence points to lax lending standards as a primary driver of the episode (see Gelain, Lansing, and Natvik 2015 for a summary of the evidence).
Figure 1 shows that the real federal funds rate computed using either headline or core PCE inflation has remained below estimates of r-star for nearly seven years, indicating that the stance of monetary policy over this period, as reflected by this conventional metric, has been accommodative.
Downward revisions to long-run potential growth
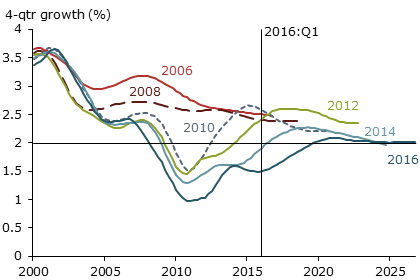
Given the postulated links between r-star and the expected growth rate of potential GDP, it is useful to examine how estimates of potential growth have changed over time. Figure 2 shows the CBO’s estimates of four-quarter potential GDP growth for various data vintages ranging from 2006 to 2016. In 2006, the long-run growth rate of potential GDP was estimated to be 2.5%, whereas in 2016 the number has been revised down to 2.0%.
Figure 2
CBO estimates of potential output growth

Standard economic models imply that a permanent downward adjustment to the long-run growth rate of potential GDP would imply a permanent downward adjustment to r-star. Consistent with this idea, the CBO’s estimate of the real interest rate that will prevail in the long run has been revised down in tandem with the downward revisions to the long-run potential growth rate (Leduc and Rudebusch 2014). If the downward shifts in r-star turn out to be permanent, it would have important implications for monetary policy by making the prospects of encountering the effective lower bound on nominal interest rates more likely in future business cycle contractions.
Given the presumed links between real interest rates, estimates of r-star, and the growth rate of potential GDP, the prevailing environment of low real interest rates has been cited by some commentators as evidence that the global economy has shifted to a low-growth regime, often referred to as “secular stagnation” (Summers 2014).
Projecting r-star 10 years ahead
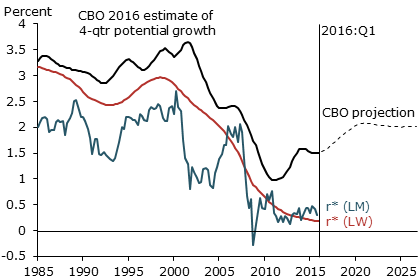
The LW and LM estimates of r-star plotted in Figure 1 do not make explicit use of CBO potential GDP data. Nevertheless, Figure 3 shows that, over the sample period from the first quarter of 1985 to the first quarter of 2016, both r-star series track reasonably well over the medium and longer term with the CBO’s implied estimate of four-quarter potential growth. The short-term relationship between the two variables is less precise, however. CBO’s most recent estimate of potential growth shows a declining trend through 2010, owing to headwinds from the Great Recession, and then a gradual recovery to 2% growth thereafter as the headwinds dissipate.
Figure 3
Potential output growth and natural rate of interest

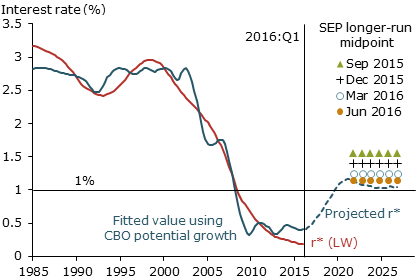
A simple statistical model of the possibly complex relationship between r-star and potential growth can be constructed by regressing an estimated time series for r-star on a flexible functional form—specifically a third-order polynomial in CBO’s potential growth estimate. This functional form could help capture nonlinearities in the relationship that may arise from the impact of time-varying uncertainty on household saving decisions and the existence of an effective lower bound on the nominal policy interest rate (Basu and Bundick 2015). Figure 4 plots the resulting fitted relationship using the LW estimate of r-star. All of the nonlinear terms in the regression equation are statistically significant and help improve the in-sample fit.
Figure 4
Fitted and projected natural rate of interest

Using the fitted relationship and CBO’s projected path for potential growth to 2026, we can construct a 10-year projected path for r-star. Such an exercise implies a gradual rise in r-star from a value near zero in early 2016 to a long-run value of around 1%, corresponding to a long-run potential growth rate of 2% in 2026. If we instead use the LM estimate of r-star to form the fitted relationship, then the resulting projected path for r-star looks similar but is slightly lower, reaching only 0.9% in 2026. Using a simple linear functional form to estimate the fitted relationship yields long-run projected values for r-star that are slightly higher by 10 to 30 basis points, or 0.10 to 0.30 percentage points.
If the long-run value of r-star is indeed only around 1% or less, then the process of normalizing the federal funds rate may end up being more gradual than the midpoint paths implied by recent SEPs.
The central tendency midpoint from the FOMC’s June 2016 SEP implies a longer-run real federal funds rate of 1.15%. This corresponds to a longer-run growth rate of 2% for real GDP, which presumably also implies a longer-run growth rate of 2% for potential GDP. The three previous SEP central tendency midpoints for the longer-run real federal funds rate were each revised down relative to the prior SEP. The central tendency midpoint was 1.55% in September 2015, 1.4% in December 2015, and 1.25% in March 2016. If we go back even further to January 2012, the central tendency midpoint was 2.25%. Thus, incoming economic data over the past several years have caused SEP participants to lower their collective assessments of the long-run value of r-star. SEP participants have also tended to revise down their forecasts of real GDP growth over the same period (Lansing and Pyle 2015).
Conclusion
The CBO currently projects a 2% long-run growth rate for potential GDP. If we assume a stable empirical relationship between r-star and potential growth, then a 2% long-run growth rate would imply a long-run r-star value of around 1% or less. Current estimates of r-star are near zero. The CBO’s projection of a gradual rise in potential growth over the next 10 years implies a similar gradual rise in r-star. If these projections are accurate, then a monetary policy designed to track the rise in r-star would imply a very gradual normalization of the federal funds rate.
Kevin J. Lansing is a research advisor in the Economic Research Department of the Federal Reserve Bank of San Francisco.
References
Basu, Susanto, and Brent Bundick. 2015. “Endogenous Volatility at the Zero Lower Bound: Implications for Stabilization Policy.” NBER Working Paper 21838.
Dokko, Jane, Brian M. Doyle, Michael T. Kiley, Jinil Kim, Shane Sherlund, Jae Sim, and Skander Van Den Heuvel. 2011. “Monetary Policy and the Global Housing Bubble.” Economic Policy 26 (66), pp. 237–287.
Gelain, Paolo, Kevin J. Lansing, and Gisle J. Natvik. 2015. “Explaining the Boom-Bust Cycle in the U.S. Housing Market: A Reverse-Engineering Approach.” FRBSF Working Paper 2015-02.
Hamilton, James, Ethan Harris, Jan Hatzius, and Kenneth West. 2015. “The Equilibrium Real Funds Rate: Past, Present and Future.” Brookings, Hutchins Center Working Paper.
International Monetary Fund. 2014. “Perspectives on Global Real Interest Rates.” Chapter 3 in World Economic Outlook: Recovery Strengthens, Remains Uneven (April).
Lansing, Kevin J. and Benjamin Pyle. 2015. “Persistent Overoptimism about Economic Growth.” FRBSF Economic Letter 2015-03 (February 2).
Laubach, Thomas, and John C. Williams. 2015. “Measuring the Natural Rate of Interest Redux.” FRBSF Working Paper 2015-16.
Leduc, Sylvain, and Glenn Rudebusch. 2014. “Does Slower Growth Imply Lower Interest Rates?” FRBSF Economic Letter 2014-33 (November 10).
Lubik, Thomas, and Christian Matthes. 2015. “Calculating the Natural Rate of Interest: A Comparison of Two Alternative Approaches.” FRB Richmond Economic Brief 15-10 (October 15).
Rachel, Lukasz, and Thomas D. Smith. 2015. “Secular Drivers of the Global Real Interest Rate.” Bank of England, Staff Working Paper 571.
Selgin, George, David Beckworth, and Berrak Bahadir. 2015. “The Productivity Gap: Monetary Policy, the Subprime Boom, and the Post-2001 Productivity Surge.” Journal of Policy Modeling 37, pp. 189–207.
Summers, Lawrence H. 2014. “U.S. Economic Prospects: Secular Stagnation, Hysteresis and the Zero Lower Bound.” Business Economics 49(2), pp. 65-73.
Taylor, John B. 2007. “Housing and Monetary Policy.” Remarks at symposium hosted by FRB Kansas City, Jackson Hole, WY (September 1).
U.S. Congressional Budget Office. 2016. The Budget and Economic Outlook: 2016 to 2026. (January).
Opinions expressed in FRBSF Economic Letter do not necessarily reflect the views of the management of the Federal Reserve Bank of San Francisco or of the Board of Governors of the Federal Reserve System. This publication is edited by Anita Todd and Karen Barnes. Permission to reprint portions of articles or whole articles must be obtained in writing. Please send editorial comments and requests for reprint permission to research.library@sf.frb.org