Some closely watched measures of inflation expectations have been in gradual decline over the past five years. Over the same time, oil prices have fallen dramatically. Although the movements in energy prices are normally considered temporary, they appear to have played a large role in pushing down some longer-term forecasts for consumer price index inflation from professional forecasters. Analysis shows the drop in energy prices can explain about three-fourths of the decline in these professional inflation forecasts over the past five years.
Policymakers closely monitor inflation expectations to both assess current trends and help forecast where inflation is headed in the future (Cao and Shapiro 2014). In light of this, the declines reported in some closely watched measures of inflation expectations from the Survey of Professional Forecasters (SPF) have been of interest. For instance, the median SPF projection for average annual consumer price index (CPI) inflation over the next 10 years, also known as the 10-year SPF, has fallen about 20 basis points, or 0.20 percentage point, over the past five years. The projection for personal consumption expenditures (PCE) price inflation over the same period has fallen by a similar amount.
By contrast, measures of inflation expectations from the SPF that focus solely on longer horizons, such as the median projection that looks ahead five years to project inflation over the next 6 to 10 years, have remained more stable. Other surveys of inflation expectations, such as the Survey of Primary Dealers conducted by the Federal Reserve Bank of New York, show a similar stable pattern for longer-term inflation expectations. This pattern suggests that variables perceived as more transitory, such as energy price movements, may be a factor in the decline of the 10-year SPF.
This Economic Letter assesses the role of energy price inflation in the decline of the median 10-year SPF projection for CPI inflation. We find that movements in energy prices can explain about three-fourths of its decline over the past five years. Specifically, our results suggest that if forecasters’ expectations of “noncore” inflation, which is driven mainly by energy prices, had remained at their 2011 level, the 10-year SPF would currently be about 0.15 percentage point higher. Overall, our analysis reveals that energy price projections are playing a large role in the decline in professional inflation forecasts because of their effects on forecasters’ anticipations in the shorter run.
The Survey of Professional Forecasters
In this Letter, we assess inflation forecasts from the Survey of Professional Forecasters, conducted quarterly by the Federal Reserve Bank of Philadelphia. The SPF surveys a sample of economists regarding their projections for many macroeconomic variables, including inflation measures over different time horizons.
The survey’s median projection for average CPI inflation over the next 10 years has declined over the past several years, as shown in Figure 1. Specifically, the median projection averaged 2.4% in 2011 and has since fallen to 2.2%. Projections for PCE inflation (not shown) also declined over this five-year period. Specifically, between 2011 and 2016, both the mean and median projections for PCE inflation over the next 10 years fell from 2.2% to 2.0%. We focus our analysis on CPI inflation projections because they have a longer historical time series.
Figure 1
CPI inflation expectations over the next 10 and 6-10 years
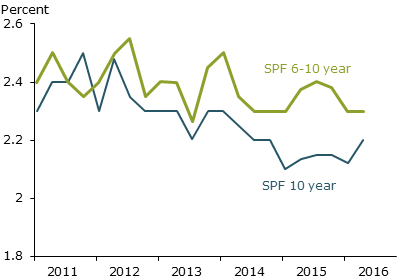
Source: FRB Philadelphia.
Figure 1 shows that inflation projections that focus solely on longer-term horizons have remained somewhat more stable than those for shorter time spans. The median projection for average annual CPI inflation over the next 6 to 10 years has fallen about 11 basis points, or 0.11 percentage point, since 2011. Comparing the two series, it seems plausible that factors normally perceived to be more temporary could be causing the downward trend in the median 10-year projection.
One of those factors is energy prices, which makes up 6.7% of the basket of goods used to determine CPI inflation. Energy prices have dramatically declined over the past five years. As shown in Figure 2, energy price inflation was close to 20% between 2010 and 2012, and then fell to zero between 2012 and 2014. Energy prices then began to decline at rates near 20% per year in 2015, but have risen somewhat since. The coinciding paths between energy inflation and the SPF’s forecast for inflation over the next 10 years raises the question of how much the two are related.
Figure 2
Year-over-year changes in CPI energy prices
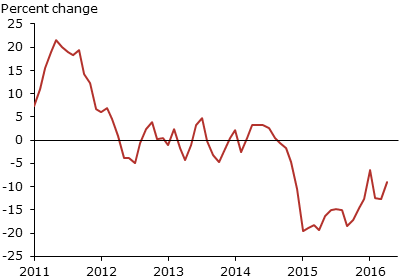
Source: Bureau of Labor Statistics (BLS).
“Noncore” inflation projections
To assess the extent to which energy inflation underlies the decline in overall inflation projections, we examine the data at the level of the individual forecaster. The SPF does not explicitly ask forecasters about their energy inflation projection. However, since energy and food prices are removed from the overall inflation measure to determine “core” inflation, we can use this information to construct a measure of each forecaster’s implied “noncore” inflation projection at each date. The SPF asks forecasters about their core inflation forecast for one, two, and three years in the future. By calculating the difference between a forecaster’s overall forecast and three-year core inflation forecast we can back out that forecaster’s implied noncore inflation forecast at the three-year horizon. Although the noncore forecast technically includes both food and energy, the energy component normally makes up most of the variation in the noncore price index. This implies that variation in a forecaster’s noncore projection is likely to have been caused by variation in his or her projections of energy prices.
Panel A of Figure 3 shows the relationship between each forecaster’s three-year noncore inflation projection and overall inflation projection at the 10-year horizon between 2011 and 2016. Specifically, each point represents a forecaster’s change in overall and noncore inflation projections over the previous year. The relationship is positive, indicating that those forecasters who lowered their three-year noncore inflation projection in a given year also lowered their 10-year overall inflation projection in that year.
Figure 3
Relationship between noncore and longer-term inflation forecasts
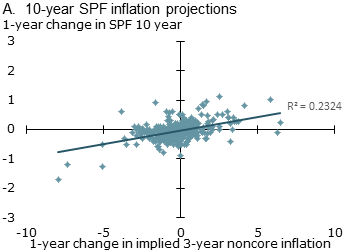
Source: BLS, FRB Philadelphia, and authors’ calculations.
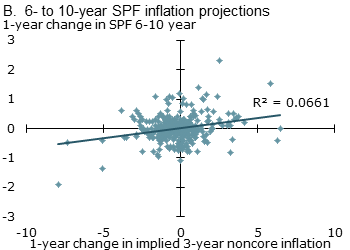
Since the noncore inflation projection is likely to include perceived transitory factors related to energy, it’s plausible to expect it to be less correlated with the forecaster’s longer-term overall inflation projection. Panel B shows this is indeed the case. That is, forecasters’ changes in their three-year noncore inflation projection less closely track the changes in their overall inflation projection at the 6- to 10-year horizon.
To quantify just how closely connected changes in a forecaster’s noncore and overall inflation forecasts are, we ran a statistical model called a fixed-effects regression. The model controls for unobserved factors specific to an individual forecaster but also accounts for observed macroeconomic conditions that are unrelated to energy prices. The results from the model imply that, all else equal, a 1% decrease in a forecaster’s noncore inflation projection translates into a decrease of 7 basis points (0.07 percentage point) in the 10-year inflation projection. Similar to the comparison between panels A and B in Figure 3, we found smaller effects on the 6- to 10-year projection: A 1% drop in a forecaster’s noncore projection was associated with a decrease of only 4 basis points (0.04 percentage point) in the 6- to 10-year forecast.
What if energy price inflation expectations had remained stable?
The close association between forecasters’ 10-year SPF and noncore short-term inflation projections gives more credence to the idea that energy-related factors contributed to the decline of the median 10-year SPF. To test whether this is the case, we consider a hypothetical scenario to assess what would have happened to overall inflation projections if forecasters’ noncore inflation projections had remained at their pre-2012 levels. To do so, we use the estimates produced from the fixed-effects model discussed earlier.
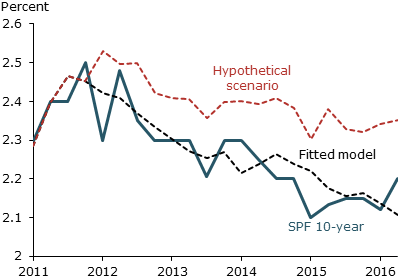
Figure 4 illustrates the results of this exercise. The solid blue line shows the actual median projection from the SPF. The dashed black line shows the median projection produced by our model, while the dashed red line shows the median projection produced by the model under the hypothetical scenario.
Figure 4
Influence on SPF from hypothetical scenario vs. model estimates
Source: BLS, FRB Philadelphia, and authors’ calculations.
The close fit of the model estimates with the SPF data means our model does a fairly accurate job of explaining variation in the median 10-year SPF inflation forecast. The hypothetical scenario model, however, exhibits no such drop and remains around 2.3 to 2.4%. The difference between the red and black dashed lines shows the effect of noncore short-term inflation projections. If noncore short-term inflation projections had stayed at their pre-2012 levels, the median 10-year SPF inflation projection would currently be about 15 basis points (0.15 percentage point) higher. Overall, this counterfactual analysis implies that about three-fourths of the decline in the median 10-year SPF inflation projection between 2011 and 2016 is attributable to movements in energy price projections.
Conclusion
The results in this Letter show that a large portion of the sustained decline in the 10-year SPF is attributable to factors related to noncore short-term inflation, which is mainly driven by energy prices. These results may be consistent with Nechio (2015), who shows that a large portion of the recent decline in long-run inflation expectations can be attributed to individual forecasters in the SPF with low forecasting accuracy. Given the well-known difficulty in forecasting oil prices (Alquist, Kilian, and Vigfusson 2013), the inaccurate forecasters may be those who place substantial emphasis on energy price movements.
Yifan Cao is a research associate in the Economic Research Department of the Federal Reserve Bank of San Francisco.
Adam Hale Shapiro is a research advisor in the Economic Research Department of the Federal Reserve Bank of San Francisco.
References
Alquist, Ron, Lutz Kilian, and Robert J. Vigfusson. 2013. “Forecasting the Price of Oil.” Chapter 8 in Handbook of Economic Forecasting 2, part A, eds. Graham Elliott and Allan Timmermann. Amstersdam: North Holland, pp. 427–507.
Cao, Yifan, and Adam Shapiro. 2014. “Will Inflation Remain Low?” FRBSF Economic Letter 2014-19 (June 30).
Federal Reserve Bank of New York. 2016. “Survey of Primary Dealers” webpage, FRB New York.
Federal Reserve Bank of Philadelphia. 2016. “Survey of Professional Forecasters” webpage, FRB Philadelphia.
Nechio, Fernanda. 2015. “Have Long-Term Inflation Expectations Declined?” FRBSF Economic Letter 2015-11 (April 6).
Opinions expressed in FRBSF Economic Letter do not necessarily reflect the views of the management of the Federal Reserve Bank of San Francisco or of the Board of Governors of the Federal Reserve System. This publication is edited by Anita Todd and Karen Barnes. Permission to reprint portions of articles or whole articles must be obtained in writing. Please send editorial comments and requests for reprint permission to research.library@sf.frb.org