A steady downward trend in health-care services price inflation over the past decade has been a major factor holding down core inflation. Much of this downward trend reflects lower payments from public insurance programs. Looking ahead, current legislative guidelines imply considerable restraint on future public insurance payment growth. Therefore, overall health-care services price inflation is unlikely to rebound and appears likely to continue to be a drag on inflation.
One way to understand why inflation has remained so low during the recovery is to look at the parts of the economy that compose its overall measurement. In this Economic Letter, we examine how different sectors contribute to the core personal consumption expenditures price index, or PCEPI. We show that recent low inflation readings largely reflect a decline in inflation for services, most of which is attributable to the health-care sector. Health-care services inflation has declined steadily over the past decade. Much of this recent fall has come from reduced growth in payments to health-care providers from public insurance programs. Current law calls for Medicare payment growth to remain very low, but future legislation could revise this path. Whichever way Medicare policy moves, though, overall health-care services inflation is likely to follow.
A decomposition of low core PCE inflation
Inflation, as measured by the PCEPI, is a weighted average of price changes across the range of products that make up total personal consumption expenditures in the U.S. economy. In this analysis, we examine core inflation, which excludes food and energy products because of their high volatility.
Figure 1 shows the contributions of goods and services—the broadest division of sectors—to core PCE inflation from January 2002 through March 2016. The dashed lines show each sector’s average contribution over the 2002 to 2007 period, calculated by multiplying the sector’s inflation rate by its weight in the PCE, so that price changes within larger sectors have more influence on aggregate inflation (Cao and Shapiro 2014). We use 2002 to 2007 because year-over-year core inflation averaged 2.0% over that time; this is the level targeted by the Federal Open Market Committee and thus is a convenient benchmark for normal inflation.
Figure 1
Core PCE inflation for goods and services compared with trends
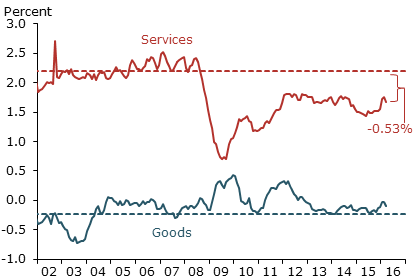
Note: Dashed lines show average inflation for sector, 2002–2007.
The figure shows that a decline in services inflation fully explains the recent drop in core PCE inflation relative to the mid-2000s. Specifically, the service sector is contributing 0.53 percentage point less to core inflation than it did before the Great Recession. By contrast, the goods sector inflation contribution has slightly increased.
We delve deeper into the services component in Figure 2, dividing it between health-care services and all other services according to the Bureau of Economic Analysis categories. The first category includes only health-related services, such as physician or hospital visits, and excludes health-care related goods such as prescription drugs, as well as nonmarket health services provided by nonprofit institutions. As Figure 2 implies, over half of the slowdown in service inflation is attributable to health care. Specifically, health-care services inflation contributes 0.29 percentage point less to core PCE inflation now than it did in the mid-2000s.
Figure 2
Health-care vs. other services contributions to core inflation
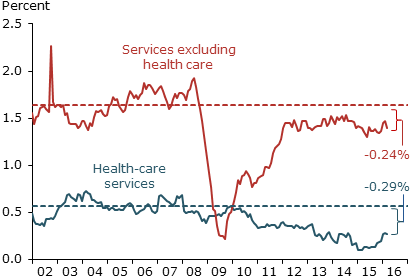
Note: Dashed lines show average inflation for sector, 2002–2007.
Looking at the contribution to overall PCE obscures the actual level of inflation within any one sector. Figure 3 shows that the level of health-care service inflation has declined from around 3.5% in the mid-2000s to 1.4% recently.
Figure 3
Health-care services price inflation
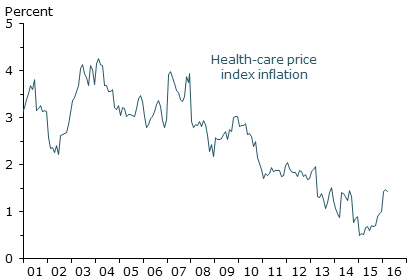
Note: Data are seasonally adjusted annual percent change.
Why is health-care services inflation so low?
To understand why health-care service inflation has declined, we must consider the unique way health-care prices are determined. The prices of health services in the PCEPI are based on payments made by insurers, either public or private, to providers such as hospitals and physicians. The public insurance programs, mainly Medicare and Medicaid, directly finance approximately half of all health-care spending. As the single largest payer, Medicare’s direct effect on health-care pricing is particularly large, directly contributing to measurable changes in health services inflation.
Both Medicare and Medicaid payment growth has slowed significantly in recent years, as illustrated in Figure 4. The figure depicts the Medicare and Medicaid hospital producer price indexes (PPI), which track payments to hospitals from these programs. During the 2000s, Medicare prices increased at a steady pace of around 4.5% per year. Payment growth subsequently decelerated due to the enactment of Medicare payment reductions. The sequestration cut in the Budget Control Act of 2011, for example, reduced Medicare payments by 2% in April 2013.
Figure 4
Medicare and Medicaid hospital producer price indexes
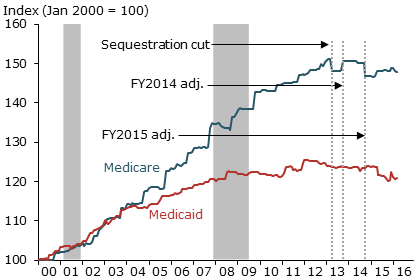
Source: Bureau of Labor Statistics.
Medicare payments are far from the only relevant recent policy change. For instance, the Medicaid fee bump to primary care physicians that began in January 2013 was reversed in January 2015. The reversal held down year-over-year health-care inflation during 2015, but this restraining factor has been eliminated, helping to push health-care inflation back up as of early 2016 (Figure 3). Another powerful force is the Affordable Care Act’s (ACA’s) recent expansion of Medicaid’s share of the insurance market. Because Medicaid payments have historically been lower and grown more slowly than payments from other payers, as Figure 4 illustrates, increases in Medicaid’s share shift the composition of payments downwards. This should also reduce health services price inflation.
Recent research documents substantial spillovers from Medicare prices to the private sector. In the context of a large private insurer’s physician payments, Clemens, Gottlieb, and Molnár (2015) find that over half of private spending is linked to Medicare’s schedule of relative payments. In the hospital setting, White (2013) finds that institutions facing Medicare payment cuts subsequently receive lower private insurance reimbursements. This research implies that Medicare can have indirect effects that significantly augment its direct effects on health-care pricing.
Clemens and Gottlieb (forthcoming) provide more direct evidence that Medicare can influence the overall level of private payments. When Medicare overhauled its geographic adjustments to physician payments, private payment rates declined in areas where Medicare payments declined, relative to areas where Medicare payments increased. The indirect effects are weakest where private markets for health-care providers are highly concentrated. Ongoing consolidation (Dunn and Shapiro 2014) may weaken this link. Clemens, Gottlieb, and Shapiro (2014) quantify the implications of this “price-following” effect for the 2013 sequester cuts and find that, through its direct and indirect effects, Medicare payment changes can significantly shape overall health services inflation.
Where is Medicare payment growth headed?
From a forecaster’s point of view, prices for Medicare services are unique because federal law specifies how they will change going forward. Each summer, the Centers for Medicare and Medicaid Services (CMS) announces payment updates for the following fiscal year (FY). Physician payments are scheduled to grow at a very slow pace due to the April 2015 Medicare Access and CHIP Reauthorization Act. Under this legislation, Medicare physician payments are scheduled for only 0.5% growth per year through 2019 and zero growth from 2019 through 2025. To put this into context, Bureau of Labor Statistics data show that physician payments across all payers grew around 2% during the mid-2000s.
Growth in Medicare’s hospital payments is more difficult to project than growth in physician payments. The primary driver of hospital payment updates is the market basket adjustment, which combines data from the hospital employment cost index and portions of the PPI representing hospitals’ input costs. Hospital payment updates are subject to additional broad-based adjustments. First is a “multi-factor productivity” adjustment instituted under the ACA. Initiated in FY2012 and scheduled to continue indefinitely, this adjustment reduces hospital payment growth in accordance with growth in economy-wide productivity. The American Taxpayer Relief Act of 2012 mandates a second adjustment to recoup historical overpayments associated with payment coding changes, reducing payments 0.8 percentage point through FY2017. The ACA mandates a third broad-based cut of 0.2 percentage point for FY2015 and FY2016, and 0.75 percentage point per year from FY2017 through FY2019. These legislated changes significantly reduce hospitals’ projected payment growth relative to the market basket adjustment. In 2016, for example, they imply a net payment increase of 0.9%, whereas the basket adjustment alone would have called for an increase of 2.4%.
The broad-based cuts scheduled under current law call for future Medicare payment growth to remain low. Further hospital-specific cuts may result from quality adjustments linked to the Inpatient Quality Reporting System, the certified Electronic Health Records program, the monitoring of hospital-acquired conditions, and the payment boost for disproportionate-share hospitals. These adjustments will, on net, reduce average payments relative to the broad-based cuts. This contrasts with recent quality adjustment legislation regarding physicians, in which reductions and rewards are largely intended to be budget-neutral.
In aggregate, these hospital-specific adjustments can create substantial differences between changes in the Medicare hospital PPI (see Figure 4) and the broad hospital adjustments. For instance, CMS had scheduled a net 1.4% broad-based increase in hospital payments for FY2015. Instead, the Medicare PPI clearly shows a decline in payments, in part reflecting improvements resulting from programs to lower hospital-acquired conditions and reduce readmissions, as well as changes to disproportionate-share hospital adjustments.
The legislation underlying CMS’s forecasts is continually subject to revision. Legislative history raises the question of whether the low payment growth called for by current law will be implemented as scheduled. For example, current payment rules under the multi-factor productivity adjustment assume significant productivity growth for hospitals, which may be difficult to achieve.
Discussion
Our analysis reveals that the heath-care sector is a major contributor to current low core PCE price inflation. The ACA and other legislation have played an important role in slowing Medicare payment growth, and current law calls for growth to remain low in coming years. There are a few caveats. Legislation is always subject to revision. Also, other programs can have offsetting effects, such as the waning of the effects that followed the Medicaid fee bump elimination.
Nevertheless, the ACA is likely to have a major influence on future health-care inflation; the law is wide-ranging and could affect prices through a variety of channels. For example, research suggests that slow Medicare payment growth may induce low growth in private payments as well. Other research points out that expansions of health insurance due to the ACA may counteract this force and apply upward pressure on payments made from private insurers (Dunn and Shapiro, 2015). Finally, the ACA has significantly expanded Medicaid’s market share, which could drive a compositional shift that would further reduce overall inflation.
Jeffrey Clemens is an assistant professor of economics at University of California, San Diego.
Joshua D. Gottlieb is an assistant professor of economics at University of British Columbia.
Adam Hale Shapiro is a research advisor in the Economic Research Department of the Federal Reserve Bank of San Francisco.
References
Cao, Yifan, and Adam Hale Shapiro. 2013. “Why Do Measures of Inflation Disagree?” FRBSF Economic Letter 2013-37 (December 9).
Clemens, Jeffrey, and Joshua D. Gottlieb. Forthcoming. “In the Shadow of a Giant: Medicare’s Influence on Private Payment Systems.” Journal of Political Economy.
Clemens, Jeffrey, Joshua D. Gottlieb, and Tímea Laura Molnár. 2015. “The Anatomy of Physician Payments: Contracting Subject to Complexity.” NBER Working Paper 21642.
Clemens, Jeffrey, Joshua D. Gottlieb, and Adam Hale Shapiro. 2014. “How Much Do Medicare Cuts Reduce Inflation?” FRBSF Economic Letter 2014-28 (September 22).
Dunn, Abe, and Adam Hale Shapiro. 2015. “Physician Payments under Health Care Reform.” Journal of Health Economics 39, pp. 89–105.
Dunn, Abe, and Adam Hale Shapiro. 2014. “Do Physicians Possess Market Power?” The Journal of Law and Economics 57(1, February), pp. 159–193.
White, Chapin. 2013. “Contrary to Cost-Shift Theory, Lower Medicare Hospital Payment Rates for Inpatient Care Lead to Lower Private Payment Rates.” Health Affairs 32(5), pp. 935–943.
Opinions expressed in FRBSF Economic Letter do not necessarily reflect the views of the management of the Federal Reserve Bank of San Francisco or of the Board of Governors of the Federal Reserve System. This publication is edited by Anita Todd and Karen Barnes. Permission to reprint portions of articles or whole articles must be obtained in writing. Please send editorial comments and requests for reprint permission to research.library@sf.frb.org