
The increase in U.S. income inequality since 1970 largely reflects gains made by households in the top 20% of the income distribution. Estimates suggest that households outside this group have suffered significant losses from foregone consumption, measured relative to a scenario that holds inequality constant. A substantial mitigating factor for the losses has been the dramatic rise in government redistributive transfers, which have doubled as a share of U.S. output over the same period.
Income inequality in the United States has increased dramatically in recent decades. Most of the increase can be traced to gains going to those near the top of the income distribution. As emphasized by Piketty (2014, p. 297), from 1977 to 2007 three-fourths of the income growth in the U.S. economy went to the top 10% of households.
This Economic Letter summarizes the results of research by Lansing and Markiewicz (2016) that gauges the welfare consequences—that is, the economic gains or losses for households—of this pattern of rising U.S. income inequality. We use an economic model designed to exactly replicate the observed paths of numerous U.S. macroeconomic variables from 1970 to 2014, focusing on shifts in the income distribution.
The welfare consequences of rising income inequality depend crucially on how it affects household consumption. We compare consumption in the actual scenario with rising inequality and transfers to consumption in a hypothetical alternative scenario in which inequality and transfers do not increase. Specifically, the alternative scenario holds household income shares and government transfers relative to output at their 1970 levels. The results indicate that the increase in income inequality since 1970 has delivered large welfare gains to households in the top 20% of the income distribution. But for households outside this group, the welfare losses relative to the alternative scenario appear to have been significant, albeit substantially mitigated by the large increase in government redistributive transfers since 1970.
Analyzing other scenarios shows that a relatively modest boost in the historical growth rate of redistributive transfers, accompanied by modestly higher average tax rates, could have achieved small but equal welfare gains for households throughout the income distribution.
The rise in U.S. income inequality
Figure 1 shows the dramatic climb in the share of before-tax income (excluding capital gains) going to the top 10% of U.S. households ranked by income. Their share increased from 32% in 1970 to 47% in 2014. The corresponding income share for the top 20% of households rose from 43% in 1970 to 51% in 2014. The faster rise of the top 10% share reflects the disproportionate gains of the highest earners.
Figure 1
U.S. before-tax income shares
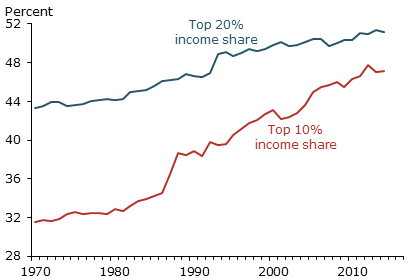
Source: Census Bureau (Table H-2), World Top Incomes database.
Another way to track income is by source. Labor income includes wages and other types of employee compensation. Capital income includes corporate profits, rental income, and net interest income. Figure 2 shows that the share of total income from capital sources increased from 35% in 1970 to 43% in 2014. During this period, the top 20% of households ranked by income owned more than 90% of total financial wealth (Wolff 2010). Given this highly skewed wealth distribution, the increase in capital’s share of income would be expected to disproportionately benefit households in the top 20% of the income distribution. But as a mitigating factor, Figure 2 also shows that government transfer payments to individuals approximately doubled, rising from about 7% of GDP in 1970 to nearly 15% in 2014. These transfer payments primarily redistribute income through various social programs, including disability and unemployment insurance, Medicare and Medicaid, and food stamps. As such, these transfers should disproportionately benefit households in the bottom 80% of the income distribution.
Figure 2
Capital’s share of income and government transfers
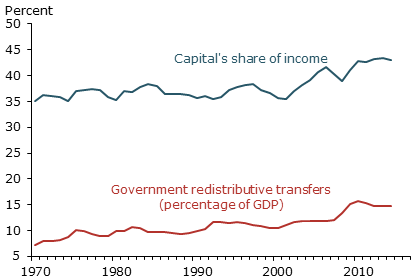
Note: Capital’s share of income is measured as 1 minus the ratio of employee compensation to gross value-added of the corporate business sector.
Source: Bureau of Economic Anlaysis (NIPA Table 1.14), FRB St. Louis FRED database.
Causes of rising inequality
There are numerous theories about the underlying causes of rising income inequality (Dabla-Norris et al. 2015). Theories involving “skill-biased technological change” emphasize the relentless shift in the ways businesses produce and distribute goods and services—a shift that raises the relative demand and wages for highly skilled and highly educated workers. Alternative theories emphasize the forces of globalization and the expansion of the financial sector, which have contributed to “off-shoring” of production and other investments designed to reduce labor costs. Finally, theories based on institutional change emphasize the decline of labor unions and the rise of stock option-based executive compensation that have contributed to an environment where earnings at the top have been pushed well above historical norms (Piketty, Saez, and Stantcheva 2014).
Modeling strategy
The Lansing-Markiewicz model includes two groups: capital owners, who represent the top 20% of the income distribution, and workers, who represent the remainder. The top income group in the model owns 100% of the economy’s financial wealth—a setup that roughly approximates the highly skewed distribution of U.S. financial wealth. Income inequality in the model rises due to technological shifts in business production methods that favor capital owners. We model these shifts to exactly replicate the observed changes over time in the top 20% income share (Figure 1) and capital’s share of income (Figure 2). The model allows for a progressive income tax system, meaning that higher income groups face higher marginal tax rates. The model also accounts for redistributive government transfers and factors that drive business cycle fluctuations. We compute the time paths of tax rates and business cycle factors so that the model exactly replicates the paths of key macroeconomic variables, including government transfers, from 1970 to 2014.
The model allows us to split aggregate U.S. consumption expenditures into the implied consumption paths for capital owners and workers. We compute the welfare gain or loss by comparing each group’s consumption path to a hypothetical alternative scenario that holds income shares and redistributive transfers at their 1970 levels.
Model simulations
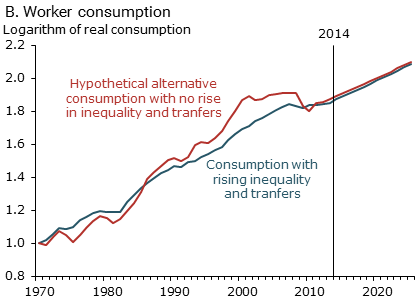
Figure 3 plots simulated consumption paths for capital owners and workers from the model. The blue lines in each panel show consumption paths with rising income inequality and transfers. The red lines show the consumption paths in the alternative scenario with no rise in income inequality and transfers. For projections beyond 2014, we assume that income shares and the ratio of transfers to output remain at 2014 levels, while the economy continues to grow at its trend rate.
Figure 3
Consumption paths for capital owners and workers
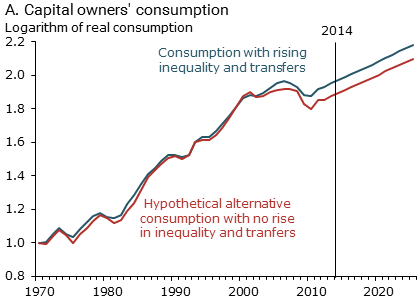
Source: Lansing and Markiewicz (2016). All series are indexed to 1 in 1970.
For capital owners (panel A in Figure 3), much of the welfare gains derive from the post-2005 upward shift in their actual consumption (blue line) relative to the alternative path (red line). This pattern can be traced to the significant increase in capital’s share of income starting around the mid-2000s, as shown in Figure 2. In the model, the increase in capital’s share of income is driven by a technological shift that causes business production methods to make more use of capital rather than labor. This shift raises the return to capital investment, and capital owners reap a large reward. In the long run, capital owner consumption shifts up by more than 10% relative to the alternative scenario.
For workers (panel B in Figure 3), actual consumption (blue line) falls below the alternative path (red line) for a substantial portion of the time from 1970 to 2014. But after 45 years, worker consumption is only slightly below the alternative path. This is due mainly to the growth in redistributive transfers, which help support worker consumption in the face of a shrinking income share.
Worker consumption eventually catches up to the alternative path around 2050 (not shown) and then starts to surpass it. The catching-up effect is driven by capital owners investing more, which contributes to more production and more output per worker, eventually resulting in a higher wage for workers. In the long run, worker consumption shifts up by about 1% relative to the alternative scenario.
One way to assess the welfare consequences of rising inequality is to ask how much a household living in the alternative scenario would need to be compensated to be indifferent about living in the actual scenario. For this calculation we adopt the perspective of a household in the year 1970. The household views gains or losses in the near term as more important than those in the distant future. If the household would need to be paid some amount more than zero, then this household would be better off living in the economy with rising inequality and transfers. But if the required compensation is negative, then the household would be willing to pay to avoid living in the economy with rising inequality and transfers.
For each capital owner household, the compensation needed to make them indifferent is 3% of their annual consumption every year in perpetuity. This figure implies a large welfare gain from living in the economy with rising inequality and transfers. By contrast, each worker household would be willing to give up 1% of their annual consumption every year in perpetuity to avoid living in the economy with rising inequality and transfers. There are four workers for every capital owner in the model. To put these numbers in perspective, 1% of U.S. nominal consumption per person in the year 2014 equaled $372.
Importance of redistributive transfers
If the ratio of transfers to output were held at the 1970 level but income inequality continued to rise as before, then the welfare loss for workers would be magnified by a factor of nine. In other words, workers would now be willing to give up 9% of their annual consumption every year in perpetuity to avoid living in the economy with rising inequality. This result shows that the historical pattern of U.S. transfer payments has done much to mitigate the negative impacts of rising income inequality for households outside the top income group.
We can also use the model to determine how transfers would have needed to grow to deliver equal welfare gains to workers and capital owners over the simulation period. According to the model, the ratio of transfers to output would have needed to increase faster, reaching 19% by 2014 versus the actual value of 15% in the data. In this case, the welfare gain for both groups turns out to be very small, amounting to only 0.12% of their annual consumption every year in perpetuity. This is due to the need for higher tax rates to finance the faster transfer growth. But these higher tax rates would still be near the low end of the range of average tax rates among OECD countries (Piketty and Saez 2013).
Conclusion
The increase in U.S. income inequality over the past half-century can be traced to gains made by those near the top of the income distribution—where financial wealth and corporate stock ownership is highly concentrated. The economic and political implications of this pattern of rising inequality have garnered substantial attention among researchers and policymakers.
According to our analysis, the increase in income inequality since 1970 has generated large welfare gains for households in the top 20% of the income distribution and significant welfare losses for those in the bottom 80%, measured relative to a scenario that holds inequality constant. Alternative simulations imply that a relatively modest boost in the historical growth rate of government redistributive transfers, accompanied by modestly higher average tax rates, could have achieved small but equal welfare gains for all households. Overall, our results suggest that there is room for policy actions that could offset the negative consequences of rising income inequality.
Kevin J. Lansing is a research advisor in the Economic Research Department of the Federal Reserve Bank of San Francisco.
Agnieszka Markiewicz is an assistant professor at Erasmus University, Rotterdam.
References
Dabla-Norris, Era, Kalpana Kochhar, Nujin Suphaphiphat, Frantisek Ricka, and Evridiki Tsounta. 2015. “Causes and Consequences of Income Inequality: A Global Perspective.” International Monetary Fund Staff Discussion Note 15/13 (June).
Lansing, Kevin J., and Agnieszka Markiewicz. 2016. “Top Incomes, Rising Inequality, and Welfare.” Economic Journal, forthcoming. (Also available as FRB San Francisco Working Paper 2012-23)
Piketty, Thomas. 2014. Capital in the Twenty-First Century. Cambridge, MA: Harvard University Press.
Piketty, Thomas, and Emanuel Saez. 2013. “Optimal Labor Income Taxation.” In Handbook of Public Economics, volume 5, eds. A.J. Auerbach, R. Chetty, M. Feldstein, and E. Saez. Amsterdam: Elsevier, pp. 391–474.
Piketty, Thomas, Emanuel Saez, and Stefanie Stantcheva. 2014. “Optimal Taxation of Top Labor Incomes: A Tale of Three Elasticities.” American Economic Journal: Economic Policy 6(1), pp. 230–271.
Wolff, Edward N. 2010. “Recent Trends in Household Wealth in the United States: Rising Debt and the Middle-Class Squeeze—An Update to 2007.” Levy Economics Institute Working Paper 589.
Opinions expressed in FRBSF Economic Letter do not necessarily reflect the views of the management of the Federal Reserve Bank of San Francisco or of the Board of Governors of the Federal Reserve System. This publication is edited by Anita Todd and Karen Barnes. Permission to reprint portions of articles or whole articles must be obtained in writing. Please send editorial comments and requests for reprint permission to research.library@sf.frb.org