
If inflation increases rapidly, how do we know that higher interest rates will bring prices under control? And how do we know how much of the monetary “medicine” to administer? Economics relies primarily on observational data to answer such questions, while medical research uses randomized controlled trials to evaluate treatments. Applying that method to economics, the long history of international finance turns out to be an excellent laboratory to conduct monetary experiments. These experiments suggest that interest rates have sizable effects on the economy.
Making sure the economy operates at full employment without triggering inflation is tricky. Price stability can conflict with supporting a thriving economy. Choosing the right dose of monetary policy thus requires understanding how interest rates affect general economic activity and prices separately. Not surprisingly, few questions in economics have received as much attention.
Medical researchers consider randomized trials the gold standard in testing alternative treatments. In this Economic Letter, we adapt this approach to measure the efficacy of interest rates in achieving economic goals. Using historical economic data, we extend a traditional economic approach of controlling for domestic factors with a novel strategy that compares data from different external institutional arrangements, our randomized trials. Our findings suggest that interest rate effects may have been previously undermeasured. This has important implications now that some central banks are preparing for a sustained tightening of monetary policy after years of near-zero interest rates.
Randomized trials in practice
When the central bank raises interest rates, inflation and economic activity usually slow down—aggregate demand is being reined in. While researchers have come up with numerous theories to explain why this might happen, precisely measuring this tradeoff is considerably more difficult. Unlike the natural sciences, economics must rely on observational rather than experimental data.
Sinclair Lewis explained experimental data eloquently:
When a physician boasted of his success with this drug or that electric cabinet, Gottlieb always snorted, “Where was your control? How many cases did you have under identical conditions, and how many of them did not get the treatment?”
Central banks do not have the luxury of running such randomized experiments—they do not roll the dice when conducting monetary policy. Inflation and output reflect monetary policy as well as the factors that determined that policy to begin with. Just as umbrellas do not make it rain, if central banks cut interest rates when the economy slows it does not mean that accommodative monetary policy causes recessions.
Economists typically measure the effects of monetary policy with a variety of statistical methods that share a common thread: They control as much as possible for the information that the central bank might have used in choosing interest rates. Any remaining variation in interest rates is considered random. That is, interest rate adjustments that differ from predictions based on available information are like quasi-random experiments. We call this leftover variation in interest rates controlled variation.
The correlation of inflation and output over time with this quasi-random controlled variation in interest rates can provide a measure of the causal effect of monetary policy. For this empirical strategy to succeed, however, one has to make sure that no relevant information is left out, which is a tall order. Unobserved factors can make this type of measurement fraught, justifying the popularity of the randomized controlled trial in the sciences.
In experimental settings, random assignment into treated and control groups forms the basis of randomized controlled trials such as those described by Sinclair Lewis. While advanced economies have not randomly entered into various monetary and trade arrangements, some of these arrangements, like the euro zone, can provide a setting for an alternative type of monetary experiment. Economies that fix their exchange rate but allow capital to move freely across borders effectively relinquish control of domestic monetary policy. In such situations, monetary policy may not respond to domestic conditions and hence may produce quasi-random variation in interest rates that is less sensitive to unobserved factors.
We take advantage of this observation, extending the traditional approach of controlling for domestic factors with a novel strategy that explores what happens to economies that have historically pegged exchange rates while allowing unfettered capital movement. While the United States does not have a pegged exchange rate, we discuss direct implications for U.S. monetary policy later.
Quasi-random monetary experiments
Over the history of modern finance, advanced economies have managed exchange rate policies in a variety of ways. Sometimes they have allowed market forces to determine the exchange rate, generally called floating exchange rate regimes—or “floats” for brevity. At other times, countries we will call “pegs” have pegged the exchange rate to another currency. Examples of peg arrangements include the classical gold standard era that ended with World War I; the Bretton Woods era that began after World War II and ended around 1973; and, the European Monetary System in the 1970s up to when the euro was rolled out in 1999.
Two countries that peg the exchange rate and allow capital to move freely must have the same short-term safe interest rate. Otherwise an investor could borrow funds in one country for less than the return offered by the other without bearing any risk—a sure way to make unlimited profit. The absence of such risk-free arbitrage essentially robs local central banks of their autonomy by forcing interest rates to equalize across borders with those set by the center country’s central bank. The mechanism just described is often referred to as the trilemma in international finance (see, for example, Obstfeld, Shambaugh, and Taylor 2005).
In a recent paper (Jordà, Schularick, and Taylor 2017), we take advantage of this phenomenon to single out episodes in which interest rates fluctuated for reasons unrelated to the domestic outlook and direct decisions by the home-country central bank. We use such episodes to calculate how interest rates affect output and inflation. These episodes are our quasi-random monetary trials. We call variation in interest rates due to these episodes peg variation.
In particular, we rely on annual data for 17 advanced economies including the United States since 1870. In our sample, countries have moved in and out of exchange rate arrangements over time. We start by focusing on the sample for country-year pairs for pegs. We find that there is a difference between controls that use only observable information and those that add information on the variation in interest rates caused by the peg. This finding can improve our understanding of the effects of monetary policy.
Interest rates are a powerful lever
If using observables for the control is sufficient, the measured response of output and inflation to interest rates using either controlled variation or peg variation should be equivalent. If there are omitted factors, any differences will arise when using controlled variation. And in that case, variation due to the peg offers a more reliable guide. Just to be sure, we also include as controls information on GDP, inflation, and several other macroeconomic conditions.
Figures 1 and 2 suggest there is cause for concern when focusing on measures based on controlled-variation. Using post-World War II data, Figure 1 shows the response of inflation-adjusted GDP per capita in response to a 1 percentage point increase in short-term interest rates in year 0 calculated two different ways. The green line uses the traditional controlled variation approach, while the red line uses the peg variation approach surrounded by a gray 90% confidence band. There is a stark difference between the two approaches. In the first case, interest rates barely cause a ripple, whereas in the second, real GDP per capita is about 2% lower in year 4 than it was at the start.
Figure 1
Cumulative response of real GDP per capita
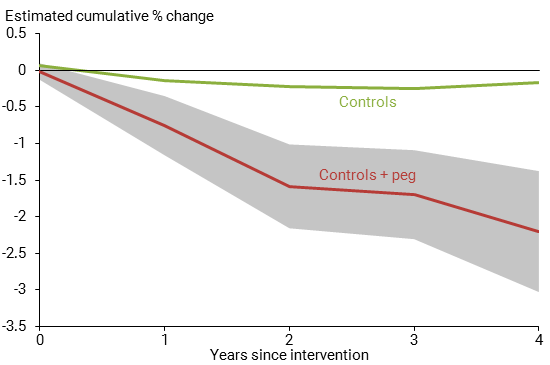
Note: Response to 1 percentage point increase in interest rates in year 0; gray shading shows 90% confidence band.
A similar picture emerges in Figure 2. The measured response of prices using controlled variation in interest rates is muted—prices are about 0.5% lower by year 4 relative to year 0. The same response calculated with peg variation is estimated to be nearly 2%. In other words, assuming a constant rate of price decline, inflation is about 0.4 percentage point per year lower.
Figure 2
Cumulative response of consumer price index level
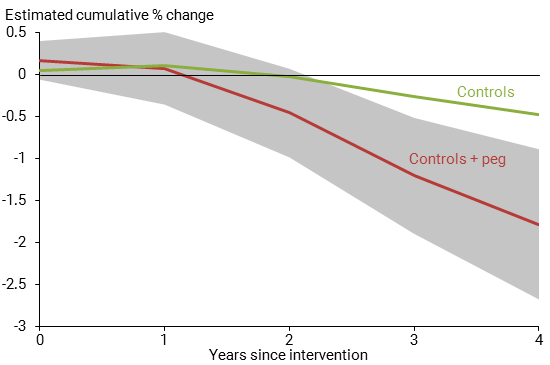
Note: Response to 1 percentage point increase in interest rates in year 0; gray shading shows 90% confidence band.
The different paths in the figures suggest that the traditional controlled variation approach undermeasures the macroeconomic impact of changes in interest rates. One possible explanation is that interest rates follow different paths after year 0 under each type of measurement approach.
Figure 3 shows that interest rate paths clearly differ somewhat between the two approaches. Measures based on peg variation indicate that interest rates go up further in year 1 but then come down very quickly. The path using controlled variation is more persistent and would tend to have a longer-lasting effect on output and prices, which clearly contradicts the actual pattern seen in Figures 1 and 2.
Figure 3
Cumulative response of short-term interest rates
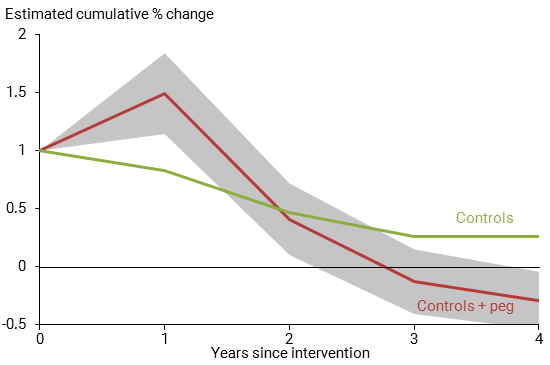
Note: Response to 1 percentage point increase in interest rates in year 0; gray shading shows 90% confidence band.
Checking the reliability of the results
What else could explain the stark differences in the figures? The first thing to check is whether there are differences between peg and float economies that would make their responses to interest rates fundamentally different. Although measures of peg variation are unavailable for floats, Jordà, Schularick, and Taylor (2017) find that controlled variation measures for both pegs and floats are, in fact, very similar, so the explanation must lie elsewhere.
Peg variation may reflect spillover effects from trade channels or other mechanisms that distort measures of the response to interest rates. Jordà, Schularick, and Taylor (2017) find that, if anything, spillover effects would tend to increase the differences.
Finally, our estimates are very similar to those reported in other research, including Romer and Romer (2004) and Cloyne and Hürtgen (2016). This line of research tries to avoid the pitfalls of the controlled variation approach using staff forecast errors from the Federal Reserve and the Bank of England, respectively, to identify exogenous changes in policy rates.
Conclusion
We do not have a definitive measure of how interest rates affect economic activity and inflation. However, along with other recent research, we find that interest rates have stronger effects on the macroeconomy than previously understood. Although the monetary experiments we use to calculate the response to interest rate changes rely on countries that peg—by contrast, the United States allows its exchange rate to freely float—there are good reasons to think that the U.S. economy responds to interest rate changes no differently. Our sample is made up of advanced economies that have institutional characteristics similar to the United States and whose economies respond much the same way as ours when using controlled variation. Without delving into the timing or path of monetary strategy more deeply, our research suggests that even a modest tightening cycle can have a substantial restraining effect on both inflation and economic activity.
Òscar Jordà is a vice president in the Economic Research Department of the Federal Reserve Bank of San Francisco.
Moritz Schularick is a professor of economics at the University of Bonn.
Alan M. Taylor is a professor of economics and finance at the University of California, Davis.
References
Cloyne, James S., and Patrick Hürtgen. 2016. “The Macroeconomic Effects of Monetary Policy: A New Measure for the United Kingdom.” American Economic Journal: Macroeconomics 8(4), pp. 75–102.
Jordà, Òscar, Moritz Schularick, and Alan M. Taylor. 2017. “Large and State-Dependent Effects of Quasi-Random Monetary Experiments.” FRB San Francisco Working Paper 2017-02.
Lewis, Sinclair. 1925. Arrowsmith. New York: Harcourt, Brace & Company.
Obstfeld, Maurice, Jay C. Shambaugh, and Alan M. Taylor. 2005. “The Trilemma in History: Tradeoffs Among Exchange Rates, Monetary Policies, and Capital Mobility.” Review of Economics and Statistics 87(3), pp. 423–438.
Romer, Christina D., and David H. Romer. 2004. “A New Measure of Monetary Shocks: Derivation and Implications.” American Economic Review 94(4), pp. 1,055–1,084.
Opinions expressed in FRBSF Economic Letter do not necessarily reflect the views of the management of the Federal Reserve Bank of San Francisco or of the Board of Governors of the Federal Reserve System. This publication is edited by Anita Todd and Karen Barnes. Permission to reprint portions of articles or whole articles must be obtained in writing. Please send editorial comments and requests for reprint permission to research.library@sf.frb.org