
The U.S. unemployment rate fell to a very low level at the end of 2016, raising the question of whether the labor market has become too tight. After applying a new method to adjust for demographic changes in the labor force, the current unemployment rate is still 0.3 to 0.4 percentage point higher than at past labor market peaks. This indicates that the labor market may not be quite as tight as the headline unemployment rate suggests.
The latest jobs report showed an unemployment rate of 4.7% for February, according to the Bureau of Labor Statistics (BLS). This jobless rate is considerably lower than the historical average of 5.8% since 1948 and has fallen below its levels during the labor market peaks of 1979 and 1989 (Figure 1, blue line). The expectation that the rate will fall even further raises the possibility that the labor market will exceed the Federal Reserve’s goal of maximum employment and could push up wages and prices substantially.
Figure 1
Unemployment rate with two demographic adjustments
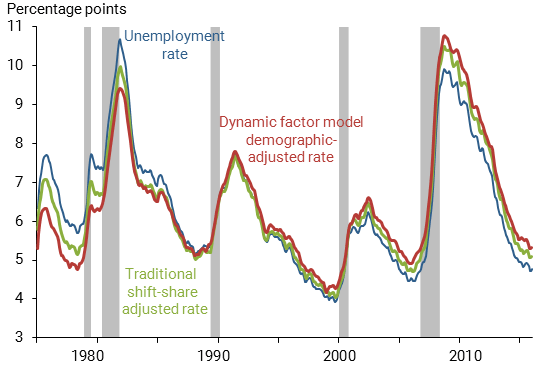
Source: BLS, authors’ calculations.
Using such comparisons of the level of unemployment over time to assess the amount of labor market slack can be problematic, however, because slow changes in the demographic composition of the workforce affect the aggregate unemployment rate. In particular, as the size and employment trends among different groups of workers change, comparisons across business cycles become increasingly difficult. Policymakers and researchers routinely adjust how they measure unemployment to account for such changes in the demographic composition of the labor force. In this Letter, we show that the standard approach to demographic adjustment—known as shift-share analysis—does not accurately capture the effect of demographics on unemployment. We use a novel adjustment method to correct for those shortcomings and find that the current unemployment rate is not unusually low compared with previous business cycle peaks.
The conventional approach to demographic adjustments
To understand the shift-share procedure, it is important to first understand how demographic changes can affect the aggregate unemployment rate. Note that the overall unemployment rate is an average of the unemployment rates for different demographic groups that have been weighted to reflect each group’s share of the labor force. A declining labor force share for a group with a high unemployment rate—for instance, young workers, whose share of the total workforce is falling due to the aging of the population—will tend to reduce the overall unemployment rate over time. A shift-share analysis (for example, Shimer 1999) compares the actual overall unemployment rate with an alternative rate calculated holding the labor force shares of the different demographic groups fixed at their value in a baseline or reference year. This approach is intended to eliminate movements in unemployment that are driven by changes in the composition of the labor force.
The green line in Figure 1 shows the result of this type of demographic adjustment. We split the labor force into 11 age/gender demographic groups and hold the labor force shares of each fixed at their 1976–2016 average value. This shift-share adjusted unemployment rate displays less of a downward trend than the published BLS unemployment rate, indicating that demographic changes have lowered the unemployment rate since the mid-1970s. But even with this adjustment, unemployment appears to be close to previous lows: As of February 2017 the shift-share adjusted rate stands at 5.0%—the same level as in the 1979 and 1989 labor market peaks (green line) and only one-tenth higher than the 2006 peak—which appears to confirm the initial impression of a tight labor market.
However, we believe this conclusion is premature. We find that the standard approach to demographic adjustment does not properly capture the full effects of demographic changes. In fact, once we address the shortcomings of the standard approach, the demographic-adjusted unemployment rate appears to be higher than all its previous lows since 1976.
Issues with the conventional approach
To illustrate why a shift-share analysis does not properly correct for the effects of labor market changes related to demographics, we explore the effect of a specific ongoing shift in the U.S. labor market: Every year, a higher fraction of high school graduates enter college, which means they stay out of the labor force instead of joining the ranks of job seekers. We will refer to this sustained demographic shift as “delayed labor force entry.”
The delayed entry of young workers has a direct effect on aggregate unemployment through the group’s labor force share: A lower fraction of high school graduates entering unemployment implies a lower share of young workers in the labor force and thus a lower aggregate unemployment rate, because young workers have the highest average unemployment rate of all demographic groups. A shift-share analysis will appropriately capture this effect.
However, the delayed labor force entry of young workers will also affect the aggregate unemployment rate through another channel: A change in the unemployment rate of young workers. A shift-share analysis will miss this effect.
To see this, we need to understand the difference between a “stock” that measures a supply at a point in time, such as the unemployment rate, and a “flow,” such as the movement of workers between the labor force states of employed, unemployed, and out of the labor force or nonparticipation. Using a simple analogy, young workers’ unemployment rate—a stock—can be seen as the amount of water in a bathtub. If you turn on the tap and pull the plug, the level of water in the tub changes with the flow of water into and out of the bathtub. If the rate of water flowing into the tub slows by turning the faucet down, while the draining rate remains the same, the water level will go down. Similarly, if a higher fraction of high school graduates go to college instead of looking for a job, this would reduce the flow of young workers entering the pool of unemployment and thus lower the young workers’ unemployment rate.
A shift-share analysis controls for demographic changes by holding labor force shares fixed in its definition of aggregate unemployment. Thus, it will completely miss the fact that a demographic change—like delayed labor force entry—can also lower the unemployment rate of young workers. In fact, by construction, a shift-share analysis will not attribute any change in young workers’ unemployment rate to demographics. Since a lower unemployment rate for young workers also implies a lower aggregate unemployment rate, a shift-share analysis will, in this example, underestimate the correction needed to account for the effects of changing demographics on aggregate unemployment.
Demographic adjustments: A new approach
To address the issues of a traditional shift-share analysis, we apply a new demographic-adjustment method (Barnichon and Mesters 2016) that uses worker flows directly instead of unemployment stocks. We construct an alternative scenario in which the aggregate unemployment rate is not driven by trends in worker flows specific to certain demographic groups only. Instead our method accounts for aggregate labor market forces, that is, movements in the flows that are common across all demographic groups. To do so, we use a dynamic factor model of the worker flows, which is a statistical analysis of the historical pattern of flows between employment, unemployment, and nonparticipation by each of the 11 demographic groups noted earlier. This statistical model allows us to separate all demographic influences from aggregate labor market trends. For instance, our procedure will identify the long-term decline in the tendency of young workers to flow into unemployment as a demographic change, because other demographic groups did not experience such a change.
Once we identify all the demographic trends, we can then purge the aggregate unemployment rate of their effects. Our demographic-adjusted unemployment rate (red line, Figure 1) stands at 5.2% as of February 2017, compared with the BLS published rate of 4.7%. Our adjusted unemployment rate is no longer lower than those in the labor market peaks of 1979 and 1989—in fact, our adjusted rate is higher than all its previous lows since 1976, with lows of 4.8% in 1979, 5.1% in 1989, 4.3% in 2001, and 4.9% in 2006. Thus, once adjusted for demographic changes, the current unemployment rate is still 0.3 to 0.4 percentage point higher than at previous labor market peaks, which indicates that the labor market may not be quite as tight as the headline unemployment rate suggests.
The effects of demographics on unemployment since the mid-1970s
Taking a longer-run perspective, we consider the effects of demographics on unemployment since the mid-1970s and their underlying causes. Figure 2 shows that demographic factors lowered the unemployment rate by about 2 percentage points over this period, according to our adjustment method. This number is substantially larger than that implied by a conventional shift-share analysis, which suggests demographics lowered unemployment by just over 1 percentage point.
Figure 2
Demographic contributions to unemployment rate
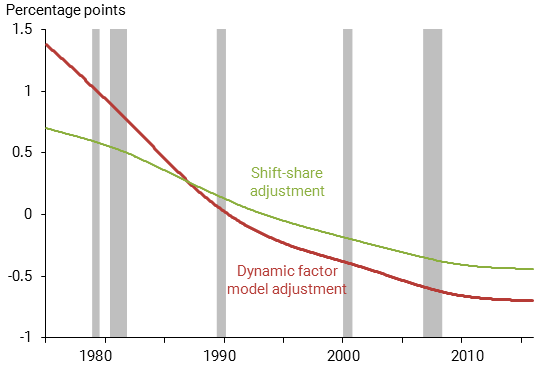
Source: BLS, authors’ calculations.
This finding raises an interesting follow-up question: Which demographic changes are responsible for the decline in unemployment since the mid-70s?
In Barnichon and Mesters (2016), we show that three demographic changes had roughly equal contributions to this decline: the aging of the baby boom generation, a trend decline in young workers’ propensity to join unemployment since the early ’80s, and a secular increase in women’s labor force attachment until the mid-90s.
We have already mentioned the first two phenomena. The last one was first documented by Abraham and Shimer (2001) and corresponds to a secular decline in the propensity of working women to leave the labor force, for instance, to raise children. This trend lowered women’s unemployment rate, because employed women are then less likely to re-enter the unemployment pool after a period of nonparticipation. Again, a conventional shift-share analysis would miss that channel entirely and thus would understate the effect of women’s stronger labor force attachment on aggregate unemployment. Thus, a shift-share analysis understates the effects of demographics because it does not take into account either the trend of fewer young workers entering the labor force or the lower propensity of women to leave employment, both of which lowered the overall unemployment rate.
Conclusion
The current low unemployment rate compared with previous labor market peaks has raised some fears regarding whether the labor market has become too tight. In this Letter, we use a new method to isolate the effects of demographic changes on unemployment, and we find that the demographic-adjusted unemployment rate is still 0.3 to 0.4 percentage point higher than it was at past labor market peaks. This indicates that the labor market may not be quite as tight as the headline unemployment rate suggests. An important caveat to this conclusion is that our analysis focuses only on the effects of demographics on aggregate unemployment. As emphasized in recent research, however, other labor market changes also may have affected aggregate unemployment since the mid-70s (see, for example, Daly, Hobijn, Sahin and Valletta 2011).
Regis Barnichon is a research advisor in the Economic Research Department of the Federal Reserve Bank of San Francisco.
Geert Mesters is an assistant professor at Universitat Pompeu Fabra and the Barcelona Graduate School of Economics in Barcelona.
References
Abraham, Katharine G., and Robert Shimer. 2002. “Changes in Unemployment Duration and Labor Force Attachment.” In The Roaring Nineties, eds. Alan Krueger and Robert Solow. New York: Russell Sage Foundation.
Barnichon, Regis, and Geert Mesters. 2016. “On the Demographic Adjustment of Unemployment.” Unpublished manuscript.
Daly, Mary C., Bart Hobijn, Ayşegül Şahin, and Robert G. Valletta. 2012. “A Search and Matching Approach to Labor Markets: Did the Natural Rate of Unemployment Rise?” Journal of Economic Perspectives 26(3, April), pp. 3–26.
Shimer, Robert. 1999. “Why Is the U.S. Unemployment Rate So Much Lower?” In NBER Macroeconomics Annual 1998, eds. Ben S.Bernanke and Julio J. Rotemberg. Cambridge, MA: MIT Press.
Opinions expressed in FRBSF Economic Letter do not necessarily reflect the views of the management of the Federal Reserve Bank of San Francisco or of the Board of Governors of the Federal Reserve System. This publication is edited by Anita Todd and Karen Barnes. Permission to reprint portions of articles or whole articles must be obtained in writing. Please send editorial comments and requests for reprint permission to research.library@sf.frb.org