
When the Federal Reserve raises short-term interest rates, the rates on longer-term Treasuries are generally expected to rise. However, even though the Fed has raised short-term interest rates three times since December 2016 and started reducing its asset holdings, Treasury yields have dropped instead. This decoupling of short-term and long-term rates is reminiscent of the “Greenspan conundrum” of 2004–05. This time, however, evidence suggests compelling explanations—a lower “normal” interest rate, the risk of persistently low inflation, and fiscal and geopolitical uncertainty—may account for the yield curve flattening.
Between June 2004 and December 2005, the Federal Open Market Committee (FOMC) substantially tightened monetary policy by increasing the federal funds rate from 1% to 4.25%. Over this same period, long-term Treasury yields, which typically move in the same direction as short-term rates, did not follow suit and instead declined. This behavior of Treasury yields puzzled most observers, including the Fed Chair Alan Greenspan, who famously termed it a “conundrum.”
Recently, the FOMC has been raising the federal funds rate target, though less frequently and starting from a lower level compared with the 2004–05 period. Since December 2016, the target range has been adjusted three times by a total of 0.75%. In addition, the FOMC began reducing the sizable holdings of Treasury and mortgage-backed securities (MBS) that the Fed had accumulated through its large-scale asset purchase programs between 2009 and 2014.
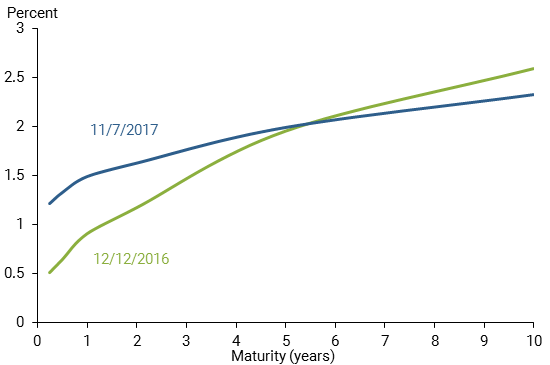
During such an episode of ongoing monetary policy tightening, long-term Treasury yields would usually be expected to rise. Since December 2016, however, they have not only not risen, but instead have fallen quite noticeably, to the surprise of professional forecasters. As a result, the yield curve has flattened over this period, as shown in Figure 1. Just like in 2004–05, short-term and long-term yields appear to have decoupled. Is there a new conundrum in the bond market? Or are there plausible explanations for this seemingly puzzling behavior of the yield curve? This Economic Letter addresses these questions, considering in turn the role of inflation, expectations of real interest rates, and other factors affecting the term premium.
Figure 1
Treasury yield curve in December 2016 and November 2017
Inflation expectations and inflation risk
Throughout 2017, inflation has remained surprisingly low. Core inflation, which excludes prices of food and energy, has slowed noticeably since March 2017 and has repeatedly fallen short of expectations. Disappointing inflation data pushed down long-term Treasury yields, as responses to the data releases have shown. For example, the May 2017 report of the consumer price index released on June 14 led to an immediate fall in the 10-year yield by about 0.1%.
While professional forecasters have lowered their near-term outlook for inflation in response to the recent data, inflation expectations over the next few quarters typically play a very small role for the 10-year yield. What matters are expectations over the entire 10 years, hence understanding the role of this expectations component requires a long-run perspective. Interestingly, long-term inflation expectations in surveys have not budged over the course of 2017 and remain firmly anchored at the Fed’s long-run inflation target of 2%, as noted in the Survey of Professional Forecasters or the New York Fed’s Survey of Primary Dealers (SPD). Overall, there is no survey evidence that suggests any meaningful downward shift in the inflation expectations underlying long-term yields.
On the other hand, inflation compensation, the difference between nominal Treasury yields and real, that is, inflation-indexed yields—based on prices of Treasury Inflation-Protected Securities, or TIPS—has fallen quite noticeably. As Figure 2 shows, between December 12, 2016, and November 7, 2017, 10-year inflation compensation fell by 0.13%, accounting for about half of the decline in the nominal 10-year yield. This further supports the view that inflation played an important role in the yield curve flattening in 2017, as does the fact that inflation compensation often fell exactly when the disappointing inflation data were released.
Figure 2
Financial market changes between December 12, 2016, and November 7, 2017
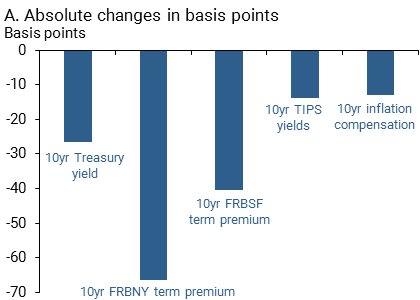
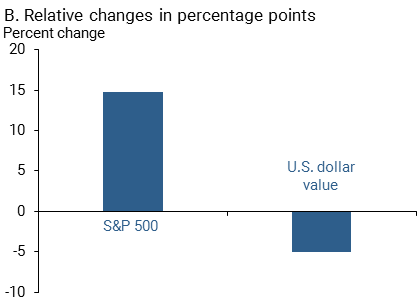
Note: Absolute changes are measured in basis points, which are hundredths of a percentage point.
An explanation that reconciles the stable survey expectations with the decline in inflation compensation and nominal yields is that the inflation risk premium has fallen. This premium compensates investors for the uncertainty about future bond returns due to changes in inflation. It is defined as the difference between inflation compensation and inflation expectations over the same horizon and can be either positive or negative, depending on whether investors are more concerned about high or low inflation. Data and market commentary suggest that, since March 2017, investors have become increasingly worried about low inflation, and that this concern about downside inflation risk has likely pushed the inflation risk premium into more negative territory. Investors are paying a higher premium for nominal bonds because they value them as a hedge against low inflation.
The equilibrium real rate and a new normal for the fed funds rate
Like expectations for future inflation, the expectations of future short-term real interest rates are a fundamental determinant of long-term yields. Here again, what matters is the average expectations over the entire maturity horizon, say 10 years. While expectations of the real short rate in the near term are affected by the business cycle and monetary policy, long-run expectations are determined and anchored by the equilibrium real interest rate, or r-star. This long-run trend of the real rate is the level at which it is expected to settle after temporary shocks and cyclical fluctuations have dissipated. Both conceptually and empirically, r-star is a key factor for explaining the swings in long-term interest rates, particularly over long periods (Bauer and Rudebusch 2017). Since long-run expectations of inflation are essentially fixed at the Fed’s inflation target of 2%, changes in r-star are the main factor affecting the long-run equilibrium level for the short-term nominal interest rate, that is, the “normal” level of the federal funds rate.
Model-based estimates of r-star in the United States and internationally have been extremely low for a number of years for structural reasons, including low productivity growth and aging populations (Williams 2017). These estimates have not fallen further over the past year. But r-star may still help explain declines in yields, because what matters for bond yields are market participants’ perceptions about r-star, rather than the output of statistical models. The concept of r-star has received increasing attention among researchers, in market commentary and in the media, and as the low estimates of r-star have become more widely discussed, market participants may have adjusted their perceptions accordingly. Furthermore, the longer-run federal funds rate in the FOMC’s Summary of Economic Projections has also gradually moved down. For example, the central tendency declined from a range of 3.0–3.3% in June 2016 to a range of 2.8–3.0% in June 2017. At the same time, survey expectations of the long-run federal funds rate have shifted down as well, as in the Blue Chip Financial Forecasts and the SPD, supporting the view that market participants and forecasters have lowered their estimates of r-star. It therefore appears that perceptions of r-star played a role not only in keeping yields near historical lows over the course of this economic recovery (Bauer and Rudebusch 2016), but also in explaining part of the more recent decline.
The term premium
The final component of long-term Treasury yields is the term premium, which captures all factors other than expectations of future inflation and real short-term rates. It includes the inflation risk premium as well as any effects of changes in supply and demand that are unrelated to expectations, such as safe-haven demand for Treasuries, market sentiment, and possible mispricing. Figure 2 shows that two prominent yield curve models from the Federal Reserve Banks of San Francisco and New York both estimate substantial declines in the term premium, even larger than the decline in yields. This is consistent with the observations of stable inflation expectations, a modest decline in perceived r-star, and a substantial decline in the inflation risk premium and other components of the term premium. Most model- and survey-based estimates agree that the term premium is currently lower than usual or even negative.
One reason for this low term premium is the Fed’s large holdings of Treasuries and MBS. By buying over $4 trillion worth of bonds, the Fed reduced the available supply of bonds, pushing prices up and yields down. While initially the Fed’s balance sheet policies also affected long-term yields by changing expectations of future short rates—that is, through so-called signaling effects (Bauer and Rudebusch 2011)—they now mainly depress the term premium. Estimates by Bonis, Ihrig, and Wei (2017) suggest that the term premium is currently about 0.9% lower than it would be without the Fed’s large securities holdings, and that this term premium effect will gradually diminish with the reduction of the Fed’s balance sheet. Recent FOMC communication about beginning the reduction did not lead to appreciable responses in Treasury yields. This suggests that investors did not substantially change their projections of the future Fed balance sheet, and that signaling effects were also largely absent. Overall, it appears that the transparent communication about and the predictable nature of the balance sheet normalization have helped the Fed avoid any sudden reactions in financial markets and a repeat of the infamous “taper tantrum” of 2013.
Expectations for fiscal stimulus through lower taxes and higher infrastructure spending, which had driven up bond yields after the 2016 presidential election, have waned in 2017, as evident in surveys, market data, and Wall Street commentary. For example, the majority of respondents to the July SPD viewed changes in the outlook for U.S. fiscal policy as an important driver for changes in the 10-year Treasury yield since December 2016. Daily movements in yields provide additional support: Treasury yields declined on days with negative headlines about domestic politics and geopolitical risks, such as increasing tension with North Korea. Domestic political and geopolitical uncertainty appears to be an important contributor to lower Treasury yields.
Other factors are also likely to have contributed to the decline in the term premium. Investors may be buying Treasury bonds to hedge their exposure to the stock market, which as Figure 2 shows has substantially appreciated in 2017. Furthermore, Treasuries have become more attractive due to accommodative monetary policy abroad, such as in the euro area, the United Kingdom, and Japan, and the increasing divergence from Fed policy. However, the falling dollar value in Figure 2 suggests that international capital flows were not the main factor driving up Treasury bond prices.
Conclusion
While an exact accounting for the factors driving long-term Treasury yields lower since late 2016 is difficult, the data suggest the following overall picture: Long-run inflation expectations have been stable, but investors are worried about the risk of lower inflation, pushing down the inflation risk premium. Perceptions of r-star have shifted down somewhat. Fed communication about balance sheet normalization has not noticeably affected the term premium, which instead appears to have declined mainly due to changes in inflation risk and political uncertainty.
Inflation expectations and perceptions of r-star typically change gradually, but there is some risk that the unusually low term premium could suddenly rise. In particular, perceived inflation risk could reverse its course quickly if inflation suddenly trended up. Similarly, if investors’ expectations about the Fed’s balance sheet were to change suddenly, or if investor sentiment about the relative attractiveness of Treasuries deteriorated for other reasons, the term premium could rise quickly. Hence there is some risk of rising Treasury yields, which some may view with concern given that high values in equity and other markets are partially based on low interest rates.
Michael D. Bauer is a research advisor in the Economic Research Department of the Federal Reserve Bank of San Francisco.
References
Bauer, Michael D., and Glenn D. Rudebusch. 2011. “Signals from Unconventional Monetary Policy.” FRBSF Economic Letter 2011-36 (November 21).
Bauer, Michael D., and Glenn D. Rudebusch. 2016. “Why Are Long-Term Interest Rates So Low?” FRBSF Economic Letter 2016-36 (December 5).
Bauer, Michael D., and Glenn D. Rudebusch. 2017. “Interest Rates Under Falling Stars.” FRB San Francisco Working Paper 2017-16.
Bonis, Brian, Jane Ihrig, and Min Wei. 2017. “The Effect of the Federal Reserve’s Securities Holdings on Longer-term Interest Rates.” Board of Governors, FEDS Notes, April 20.
Williams, John C. 2017. “The Global Growth Slump: Causes and Consequences.” FRBSF Economic Letter 2017-19 (July 3).
Opinions expressed in FRBSF Economic Letter do not necessarily reflect the views of the management of the Federal Reserve Bank of San Francisco or of the Board of Governors of the Federal Reserve System. This publication is edited by Anita Todd and Karen Barnes. Permission to reprint portions of articles or whole articles must be obtained in writing. Please send editorial comments and requests for reprint permission to research.library@sf.frb.org