
Potential output—the maximum amount an economy can produce over the long run—is an important indicator policymakers use to gauge a country’s current economic health and expectations for future growth. However, potential output can’t be observed directly, and estimating it is difficult, even with modern, sophisticated methods. Monetary policymakers are well advised to account for the perennial problem of uncertainty surrounding these estimates in devising and carrying out policy strategies.
A venerable concept in both macroeconomics and monetary policy is that of potential output, defined to be the maximum amount the economy can produce on a sustained basis (Okun 1962; Weidner and Williams 2009). Potential output depends on the supply side of the economy, that is, the number of willing and able workers and the amount that each can produce. Although the economy may rise above potential output during a boom and drop below it during a recession, on average it will tend to gravitate towards it.
Despite the theoretical importance of the concept of potential output and the considerable efforts by economists to measure it, in practice, it has proven fiendishly difficult to pin down with any precision. This Economic Letter uses the past decade’s experience as a case study of why it can be so hard to measure potential output accurately and suggests some solutions for mitigating the deleterious effects of this problem.
Why does potential output matter?
The concept of potential output plays an important role in forecasting the longer-term direction of the economy and in monetary and fiscal policy. Its importance for forecasting stems from the observation that, over the longer term, actual output tends to move in line with potential output. Therefore, potential output is a crucial factor in thinking about where the economy is likely to end up in the future.
With regards to monetary policy, the two main goals of the Federal Reserve—to maintain full employment and price stability—both are linked, directly or indirectly, to potential output. First, a labor market operating at full employment corresponds to an economy operating at its potential. Second, the inflation rate depends in part on how the economy is performing relative to its potential. All else being equal, an economy operating above potential creates inflationary pressures, and an economy running below potential pushes inflation down. Finally, potential output is important for analyzing and conducting fiscal policy because the underlying trends in tax revenue, spending, and deficits depend on the longer-term trends in the economy.
Three challenges in measuring potential output
In theory, the measurement of potential output should be relatively straightforward. By definition, potential output is the product of potential output per worker, or “productivity,” and the total number of employed workers when the economy is at full employment, or “labor supply.” Unfortunately, you can’t look these numbers up in statistical tables, but instead must estimate them using a model informed by the available evidence. The devil, however, as is often the case in economics, is in the details.
Three main challenges plague efforts to obtain reliable estimates of potential output. The first is that economic data are themselves “estimates” that are regularly revised as new, more accurate information becomes available and is incorporated into the official statistics. These revisions may in turn affect one’s view of potential output. Second, subsequent events can provide additional information and perspective on the underlying supply-side factors that shape potential output, creating a second source of after-the-fact revisions.
Finally, even with all the data in hand and applying the best methods, potential output is by its nature an unobservable quantity, and it is inherently difficult to clearly distinguish between shifts in the supply side of the economy and other influences on output. At the end of the day, there will always remain some residual uncertainty about estimates of it (Orphanides and van Norden 2002).
These problems are not only in theory but have also proven to have enormous detrimental consequences in practice. During the 1960s and 1970s, many estimates of potential output in the United States proved to be overly optimistic (Orphanides 2003). This error was not without consequence. Arguably, during this period, Federal Reserve policymakers believed that the economy was operating much further below its potential than it actually was. This may have contributed to actions that ultimately overheated the economy and contributed to a large, sustained increase in inflation (Orphanides 2002).
Building a better potential mousetrap
Since the 1970s, economists have developed new models and techniques to estimate potential output with the hope of obtaining better estimates and not repeating the errors of the past. Although there is general agreement on the definition of potential output, there is no consensus on the best method to measure it, and estimates can differ depending on the assumptions and methods used in obtaining them. As a result, any single method of estimating potential output is subject to considerable uncertainty and error.
The Congressional Budget Office (CBO) regularly prepares and updates estimates of potential output for the United States. It conducts a detailed analysis of the trends in various factors related to productivity and the supply of labor. It takes a bottom-up approach that builds up the estimate of potential output from all of these components (CBO 2001). CBO estimates and forecasts of potential output are typically updated and published twice a year.
In constructing its estimates, the CBO assumes that the growth rate of potential output does not fluctuate dramatically from quarter to quarter or year to year. Instead, it focuses on medium- and longer-term movements in supply-side factors and generates estimates of potential output that are relatively smooth.
At the other extreme, some approaches to measuring potential output assume that the factors affecting potential output are constantly in flux and may be subject to frequent and large changes (Edge, Kiley, and Laforte 2008). One such approach is provided by the model of Laubach and Williams (2003). They apply a top-down approach that infers potential output from data on inflation, gross domestic product (GDP), and interest rates. A statistical method called the Kalman filter is used to distinguish between shifts in output due to movements in potential output and those stemming from other sources.
The past decade: A case study
The experience of the past decade provides a case study of whether the advances in estimating potential output have solved, or at least significantly reduced, the problems that have plagued it in the past. In the end, three challenges in estimating potential output proved particularly acute during the severe economic turmoil in the aftermath of the global financial crisis.
The first problem affecting the measurement of potential output was that the GDP data were later revised significantly lower for the years of the recession and early part of the recovery. The blue line in Figure 1 shows the current, revised estimates of real GDP from 2007 through the first half of 2017. For comparison, the green line shows the “real-time” estimates of real GDP that were published a few months after the end of the quarter covered by the GDP estimate. For example, the real-time estimate of real GDP for the first quarter of 2010 equals the official government estimate published in the second quarter of that year. Based on what we know now, the decline in GDP in 2009 was much steeper and slower to recover than originally thought. In contrast, since 2011, the differences between the real-time and revised estimates of GDP have been comparatively small.
Figure 1
Estimates of real GDP, real-time and current
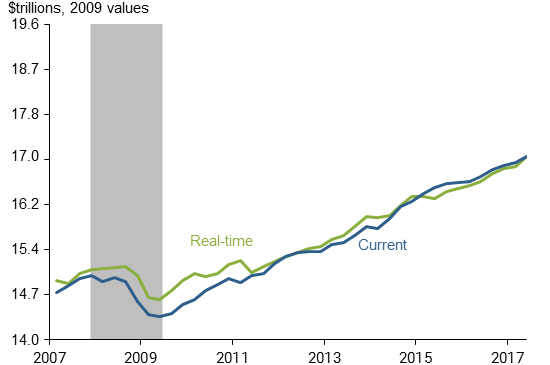
Source: Bureau of Economic Analysis, Federal Reserve Bank of St. Louis, and author’s calculations; in log values.
The second problem was that estimates of potential output before the recession were overly optimistic. The red dashed line in Figure 2 shows the CBO’s estimate and forecast for potential GDP from early 2007. For comparison, the solid blue line shows the current, revised CBO estimates of potential output for the past decade (CBO 2017). The retrospective assessment is that potential output was much lower than estimates at the time indicated.
Figure 2
CBO estimates of potential real GDP
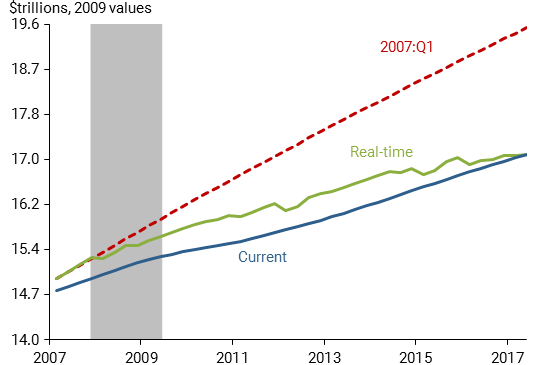
Source: Congressional Budget Office and author’s calculations; in log values.
The evolution of the economy over the past decade caused the CBO to repeatedly lower its estimates of potential output. The green line in Figure 2 shows the real-time estimates of potential output for each quarter over the past decade. Since the CBO typically updates its estimates only twice a year, the latest available CBO estimate is used. Nearly all the revisions are downward relative to the real-time estimates, and the magnitude of the revisions are very large. In fact, the current estimate of potential output in the second quarter of 2017 is over 12% lower than was forecast in early 2007. These changes reflect the surprising slowdown in underlying trends in productivity and labor force growth that have occurred over the past decade (Fernald et al. 2017).
Large downward revisions are also seen in the Laubach-Williams (LW) estimates. The solid blue line in Figure 3 shows the current LW estimates for potential output, the dashed red lines show the model forecast from early 2007, and the green line shows the real-time estimates. Like the CBO estimates, the current LW estimates of potential output in 2007—before the recession—are below the real-time estimates. And, like the CBO estimates, the current LW estimates are mostly lower than the real-time estimates, although the magnitude of the LW revisions since 2011 are relatively small compared with the CBO revisions.
Figure 3
Laubach-Williams estimates of potential real GDP
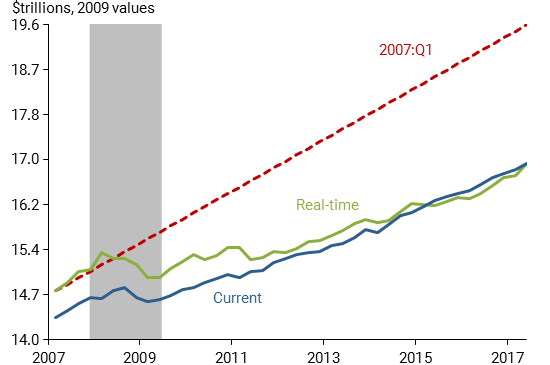
Source: Updated estimates from Laubach and Williams (2003); in log values.
Even with all that we’ve learned, considerable uncertainty remains about the path of potential output over the past decade. Although the two sets of current estimates share the same general upward trend over that time, at any point in time the two estimates differ by up to 4.6 percentage points. As of the second quarter of 2017, the two estimates differ by only 1 percentage point, but this serendipity may not persist. Moreover, other estimates differ from the two described here, with some suggesting that potential output is much higher today than the CBO and LW estimates. This reinforces the message that it is inherently difficult to pinpoint potential output and that estimates are sensitive to assumptions and methodology.
What can be done?
Given the difficulty in estimating potential output even with modern, sophisticated methods, what is the alternative? One approach is to rely on other indicators that appear to be more stable over time. In particular, the unemployment rate is often used as a key indicator of the cyclical state of the economy (Fleischman and Roberts 2011, Fernald et al. 2017). One can then derive the level of potential output based on the difference between the unemployment rate and its long-term trend.
This approach has the advantage of reducing the problem of estimating the supply side of the economy, as in the CBO and LW approaches, but it presents its own challenges, too. For one, the structure of the labor market evolves over time, and with it the full-employment level of the unemployment rate. In practice, measuring the full-employment level of unemployment has proven nearly as difficult as measuring potential output (Orphanides and Williams 2002, 2013). Second, there are numerous indicators of the strength of the labor market besides the unemployment rate, which may at any point in time give a different reading of labor market slack, and choosing between them can give a different answer about potential output (Weidner and Williams 2011).
In light of the reality that measuring potential output is very difficult despite the best efforts, it pays to avoid overreliance on these estimates when possible. In particular, there has been considerable research on the problem of conducting monetary policy with imperfect estimates of potential output or the full-employment level of unemployment (Williams 2017).
One recurring finding of this research is that a policy strategy that targets the price level and responds to the unemployment rate can be highly effective at stabilizing both inflation and unemployment when policymakers are uncertain about the economy’s potential (Orphanides and Williams 2002, 2013). In a nutshell, the big advantage of the price-level targeting approach is that swings in the inflation rate need to be made up in the future. This assures that, over the medium term, inflation stays on track, even if policymakers have a very imperfect understanding of the levels of potential output or other structural changes affecting the economy.
In sum, past experience teaches us that the measurement of potential output is a perennial problem that is unlikely to vanish in the foreseeable future. Monetary policymakers are well advised to take this uncertainty into account in devising and carrying out their policy strategies.
John C. Williams is president and chief executive officer of the Federal Reserve Bank of San Francisco.
References
Congressional Budget Office. 2001. “CBO’s Method for Estimating Potential Output: An Update.” August.
Congressional Budget Office. 2017. “An Update to the Budget and Economic Outlook, 2017-2027.” June.
Edge, Rochelle M., Michael T. Kiley, and Jean-Philippe Laforte. 2008. “Natural Rate Measures in an Estimated DSGE Model of the U.S. Economy.” Journal of Economic Dynamics and Control 32, pp. 2,512–2,535.
Fernald, John G., Robert E. Hall, James H. Stock, and Mark W. Watson. 2017. “The Disappointing Recovery of Output after 2009.” Brookings Papers on Economic Activity 2017(1), pp. 1–58.
Fleischman, Charles, and John Roberts. 2011. “From Many Series, One Cycle: Improved Estimates of the Business Cycle from a Multivariate Unobserved Components Model.” Board of Governors, Finance and Economics Discussion Series Working Paper 2011-46.
Laubach, Thomas, and John C. Williams. 2003. “Measuring the Natural Rate of Interest.” Review of Economics and Statistics 85(4, November), pp. 1,063–1,070.
Okun, Arthur. 1962. “Potential Output: Its Measurement and Significance.” In 1962 Proceedings of the Business and Economic Section. Washington, DC: American Statistical Association.
Orphanides, Athanasios. 2002. “Monetary Policy Rules and the Great Inflation.” American Economic Review, Papers and Proceedings 92(2, May), pp. 115–120.
Orphanides, Athanasios. 2003. “The Quest for Prosperity without Inflation.” Journal of Monetary Economics 50, pp. 633–663.
Orphanides, Athanasios, and Simon van Norden. 2002. “The Unreliability of Output-Gap Estimates in Real Time.” Review of Economics and Statistics 84(4, November), pp. 569–583.
Orphanides, Athanasios, and John C. Williams. 2002. “Robust Monetary Policy Rules with Unknown Natural Rates.” Brookings Papers on Economic Activity 2002(2), pp. 63–145.
Orphanides, Athanasios, and John C. Williams. 2013. “Monetary Policy Mistakes and the Evolution of Inflation Expectations.” In The Great Inflation: The Rebirth of Modern Central Banking, eds. Michael D. Bordo and Athanasios Orphanides. Chicago: University of Chicago Press.
Weidner, Justin, and John C. Williams. 2009. “How Big Is the Output Gap?” FRBSF Economic Letter 2009-19 (June 12).
Weidner, Justin, and John C. Williams. 2011. “What Is the New Normal Unemployment Rate?” FRBSF Economic Letter 2011-5 (February 14).
Williams, John C. 2017. “Preparing for the Next Storm: Reassessing Frameworks and Strategies in a Low R-star World.” FRBSF Economic Letter 2017-13 (May 8).
Opinions expressed in FRBSF Economic Letter do not necessarily reflect the views of the management of the Federal Reserve Bank of San Francisco or of the Board of Governors of the Federal Reserve System. This publication is edited by Anita Todd and Karen Barnes. Permission to reprint portions of articles or whole articles must be obtained in writing. Please send editorial comments and requests for reprint permission to research.library@sf.frb.org