A labor force participation rate that is at or above its long-run trend is consistent with a labor market at or above full employment. In 2018, the estimated rate is at its trend of 62.8%, suggesting that the labor market is at full employment. Studying the population’s demographic makeup and labor trends for different groups sheds some light on what is driving the aggregate participation trend and implications for the future. Projections based on these trends estimate that labor participation will decline about 2.5 percentage points over the next decade.
The labor force participation rate is the share of people ages 16 and older who are either working or actively looking for work. A participation rate that is at or above its potential rate or so-called long-run trend is a signal that the labor market is at or above full employment. Therefore, policymakers are very interested in understanding what parts of the participation rate reflect a longer trend and which are considered more transitory factors that adjust with the health of the economy.
While estimating the trend of the unemployment rate, also known as the natural rate, has a long tradition in economics, studying the trend in the labor force participation (LFP) rate is relatively new. Before 2000 labor force participation did not exhibit noticeable cyclical variations; rather it increased steadily. After 2000 the rate started to drop, and this decline accelerated with the deep recession of 2007–09. Since 2015, it has been hovering around 62.8%, its lowest level since 1978. With the unemployment rate currently at historically low levels, understanding how far the LFP rate is from its potential helps better gauge the health of the labor market.
In this Letter, we construct the aggregate LFP trend from the LFP trends of demographic groups that make up the aggregate. That is, the LFP trend reflects the demographic composition of the population and the potential LFP rates of those different groups.
We find that the LFP rate is at its trend of 62.8% in 2018, suggesting that the labor market is at full employment. Our estimate is roughly consistent with the Congressional Budget Office (CBO) estimates of the trend for 2018. Furthermore, we project that the trend will decline approximately 2.5 percentage points over the next decade.
Changes in the demographic composition of the population
The aggregate LFP rate is the weighted sum of the rates of different demographic groups, where the weights are the groups’ population shares. Similarly, the trend in the aggregate rate is the weighted sum of the trends of the groups’ LFP rates. That is, the change in the aggregate trend is driven by (1) changes in the demographic composition of the population, and (2) changes in the trends of different groups.
There are substantial differences in the LFP rates of the different demographic groups. For example, people ages 25 to 54 have a higher participation rate than older or younger groups (Figure 1, panel A). Also, people with higher educational attainment participate at higher rates than those with lower education levels.
Figure 1
Labor force participation and population shares by age group
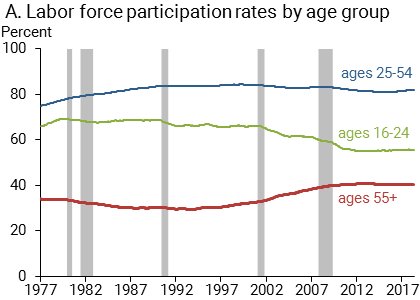
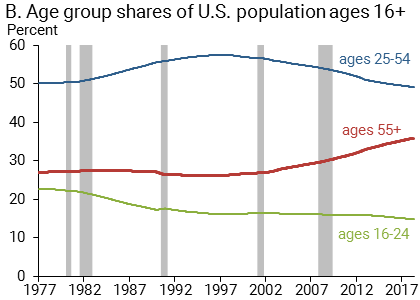
Source: Authors’ calculations using Current Population Survey microdata.
In recent decades, the demographic composition of the U.S. population has exhibited substantial changes. Most notably, the population has gotten older (Figure 1, panel B). Because the older group’s participation rate is lower, the compositional shift towards an older population would lower the aggregate LFP rate even if the rates of different groups remained unchanged. The educational attainment of the population has also increased in recent decades. In the first quarter of 2000, the share of individuals with a bachelor’s degree or higher among those ages 25 and older was 26%, while this share rose to 35% in the first quarter of 2018. The shift towards more-educated groups increases aggregate labor force participation because individuals with higher education levels have higher LFP rates.
How much do demographic changes affect the overall LFP rate trend?
To quantify how much of the decline in the aggregate LFP rate is driven by changes in the composition of the population, we construct two hypothetical aggregate LFP rate scenarios. In this approach, we use Current Population Survey (CPS) microdata from the Bureau for Labor Statistics for 1976–2018 and split the population into 56 age-gender-education groups based on seven age, two gender, and four educational categories. Figure 2 shows the actual (blue line) and our two scenarios for aggregate LFP rates.
Figure 2
LFP and two scenarios based on demographic composition
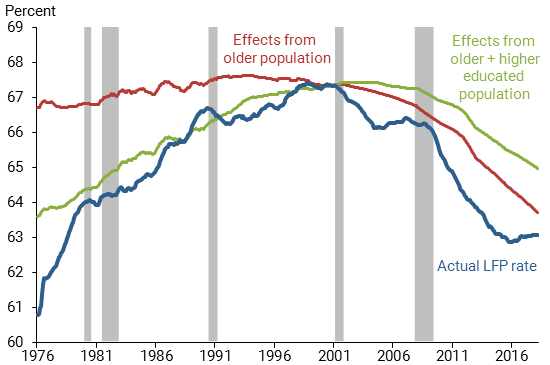
Source: Authors’ calculations using CPS microdata.
Our first scenario estimates how much the compositional shift towards an older population has changed the aggregate LFP rate. To construct this alternative rate, we fix the participation rate of each group at their levels from 2000, when the aggregate LFP reached its peak, and also fix the educational composition of the population at its 2000 level. We then use the actual age-gender population shares as weights. The red line in Figure 2 shows how much the aggregate LFP rate would have changed if the groups’ LFP rates and educational composition had remained at their 2000 levels but the age-gender composition of the population had evolved as in the data. Driven only by the changes in the age-gender composition, the resulting aggregate rate would have declined about three-fourths as much between 2000 and 2018 as it actually did. In other words, changes in the age-gender composition of the population contributed about three-fourths to the decline in the LFP rate.
In the second hypothetical scenario, we further examine how much the increased educational attainment of the population contributed to the increase in the aggregate LFP rate. For example, Daly, Jackson, and Valletta (2007) show how shifts towards a more educated population have affected wages and unemployment. For this purpose we only fix the groups’ LFP rates at their 2000 levels, but we allow the educational distribution of each age-gender group to evolve as in the data. The green line in Figure 2 shows that this alternative scenario for the LFP rate would have declined half as much as the actual rate and less than in the first hypothetical scenario. This indicates that increased educational attainment in the U.S. population between 2000 and 2018 undid a substantial part of the decline due to the aging of the U.S. population.
These hypothetical scenarios show that between 2000 and 2018 changes in the population composition substantially lowered the aggregate participation rate and its trend. Figure 2 also shows that the actual aggregate LFP rate in 2018 is lower than our composition-driven scenarios. This means that different demographic groups’ participation rates also changed and played a role in lowering the aggregate rate. We now turn to estimating the trends in the LFP rates of different demographic groups.
Our approach for estimating trends in demographic group participation
Estimating the trends for group-specific LFP rates requires us to first disentangle changes in the group rate into the slow-moving factors that are not affected by cyclical developments in the labor market and other changes that are driven by cyclical fluctuations. The former defines the trend in the group participation rate.
Researchers have developed age-cohort models of the demographic group trends (Aaronson et al. 2006, Aaronson et al. 2014, CBO 2018, and Montes 2018). In these models, the trend for the age-specific LFP rate of a demographic group defined by gender and education is the sum of an age effect (how old you are) and a cohort effect (when you were born). Typically, the time variation of the age-specific LFP rate is attributed to cohort effects and the age effect is considered fixed, but age-specific LFP rates vary quite a bit more than can be accounted for by cohort effects. For example, older workers participate at higher rates now than they did two decades ago because they live longer and healthier lives; young workers ages 16 to 24 participate at a much lower rate than in the 1990s in part due to higher school attendance rates. Augmenting a model with structural variables such as school enrollment and social security payouts helps capture the evolving age effects. However, such an approach requires a large number of these structural variables to estimate the historical trend, as well as numerous forecasts of these variables for forecasting the trend.
Our approach allows for time variation in the age effects of group-specific LFP rates. We simply assume that the age and cohort effects for each gender-education group vary over time. We then estimate the age and cohort effects using standard data filtering techniques. Our approach requires no structural variables in estimation or forecasting.
The trend in the aggregate LFP rate and its projections
We construct the aggregate LFP rate trend and its projection using our estimates of the trends of different demographic groups and the actual population shares. In the estimation, we use the CBO’s projections of the age composition of the population and fix the educational composition at the latest data point. Figure 3 shows the actual LFP rate and our estimate of its trend.
Figure 3
Actual LFP rate and the estimated trend
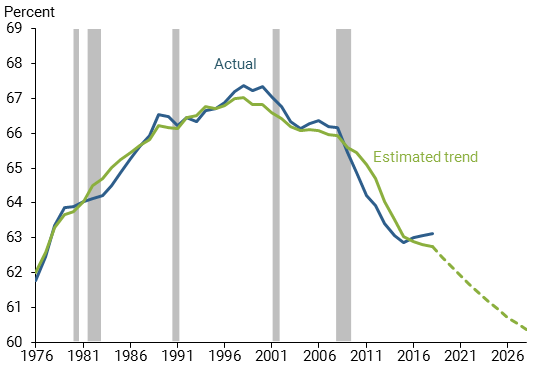
Source: Authors’ calculations using CPS microdata.
We find that the rate is at its trend of 62.8% in the first half of 2018. This is roughly consistent with the CBO’s estimate of the trend. We estimate that the aggregate trend will decline by approximately 2.5% in the next decade. Given that our method of estimating the group trends is different from the CBO’s, the close similarity of the projections of the trend for the aggregate participation rate implies that almost the entire projected future decline is driven by population aging.
Conclusion
In this Letter, we use a simple statistical model to construct the trend in the aggregate labor force participation rate and its projections over the next 10 years.
Our estimates indicate that the aggregate labor force participation rate is at its trend as of 2018. Combined with the low unemployment rate, this argues that the U.S. labor market is operating at or beyond its full potential. This finding is consistent with other recent work that finds that the decline in the LFP rate reflects longer-term developments (Valletta and Barlow, 2018, Daly et al. 2018).
Andreas Hornstein is a senior advisor at the Federal Reserve Bank of Richmond.
Marianna Kudlyak is a research advisor in the Economic Research Department of the Federal Reserve Bank of San Francisco.
Annemarie Schweinert is a Ph.D. student in economics at the University of Wisconsin-Madison and a former research associate at the Federal Reserve Bank of San Francisco.
References
Aaronson, Stephanie, Bruce Fallick, Andrew Figura, Jonathan Pingle, and William Wascher. 2006. “The Recent Decline in the Labor Force Participation Rate and Its Implications for Potential Labor Supply.” Brookings Papers on Economic Activity 2006(1), pp. 69–134.
Aaronson, Stephanie, Tomaz Cajner, Bruce Fallick, Felix Galbis-Reig, Christopher Smith, and William Wascher. 2014. “Labor Force Participation: Recent Developments and Future Prospects.” Brookings Papers on Economic Activity Fall, pp. 197–275.
Congressional Budget Office. 2018. The Budget and Economic Outlook: 2018 to 2028. Report, April 9.
Daly, Mary C., Joseph H. Pedtke, Nicolas Petrosky-Nadeau, and Annemarie Schweinert. 2018. Why Aren’t U.S. Workers Working?” FRBSF Economic Letter 2018-24 (November 13).
Daly, Mary C., Osborne Jackson, and Robert G. Valletta. 2007. “Educational Attainment, Unemployment, and Wage Inflation.” FRBSF Economic Review 2007, FRB San Francisco.
Montes, Joshua. 2018. “CBO’s Projection of Labor Force Participation Rates.” Congressional Budget Office Working Paper 2018-04, March 16.
Valletta, Rob, and Nathaniel Barlow. 2018. “The Prime-Age Workforce and Labor Market Polarization.” FRBSF Economic Letter 2018-21 (September 10).
Opinions expressed in FRBSF Economic Letter do not necessarily reflect the views of the management of the Federal Reserve Bank of San Francisco or of the Board of Governors of the Federal Reserve System. This publication is edited by Anita Todd and Karen Barnes. Permission to reprint portions of articles or whole articles must be obtained in writing. Please send editorial comments and requests for reprint permission to research.library@sf.frb.org