
Kevin J. Lansing, research advisor at the Federal Reserve Bank of San Francisco, states his views on the current economy and the outlook.
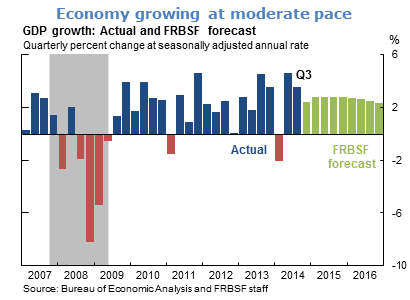
- The initial estimate of real GDP growth in the third quarter of 2014 was 3.5% at an annual rate. A jump in federal defense spending and an increase in net exports made outsize contributions to growth in the initial estimate. More recent data on net exports suggest that third quarter growth is likely to be revised down to around 3% in subsequent estimates.
- We expect growth in the fourth quarter of 2014 to come in around 2.5%. For 2015, we expect growth to pick up to around 2.8%. This is about 0.5 percentage point above the growth rate observed over the 21 quarters since the end of the Great Recession. The primary downside risk to the U.S. growth outlook is a possible slowdown in global economic activity, which may be a factor underlying the recent sharp declines in crude oil prices.
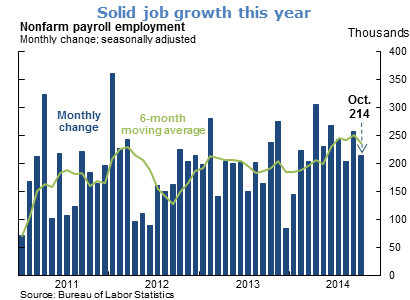
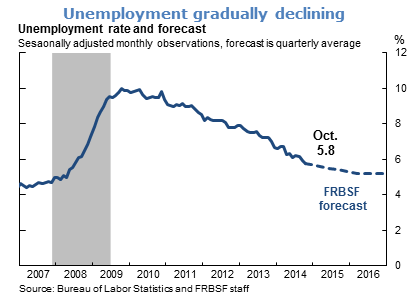
- Payroll employment growth has been consistent this year, with the latest figure for October representing the ninth straight month of job gains above 200,000. Continued solid job growth is expected to push down the unemployment rate to 5.3% by the end of 2015, close to the level of 5.2% that we judge to be the natural rate of unemployment.
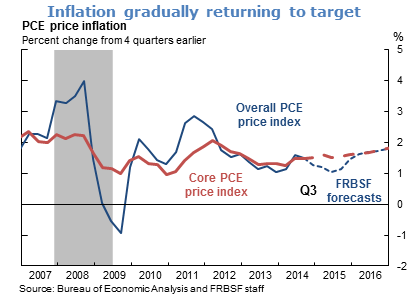
- Inflation, as measured by the four-quarter change in the personal consumption expenditures (PCE) price index, has remained below the Federal Open Market Committee’s (FOMC) 2% target since mid-2012. Recent declines in energy prices are expected to temporarily push down PCE inflation in the near-term. Looking past these transitory effects, we expect PCE inflation to rise gradually towards 2% as economic slack dissipates.
- The cumulative and ongoing improvements in labor market conditions are key factors underlying the FOMC’s decision to end its asset purchase program in October. However, with substantial economic slack and inflation below the FOMC’s target, monetary policy remains highly accommodative.
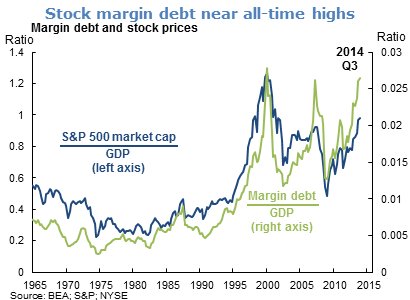
- Stock market gains have been an important feature of the U.S. economic expansion. The ratio of the Standard & Poor’s (S&P) 500 stock market index capitalization to GDP is currently around 100%—approximately double the value that prevailed at the market bottom in 2009:Q1. While elevated, the ratio remains below the value of 126% that was observed at the market peak in 2000:Q1.
- The ratio of New York Stock Exchange margin debt to GDP has risen sharply in recent years and is currently near all-time highs, signaling the increasing willingness of investors to buy stocks using borrowed money. Similar sharp rises in the ratio of margin debt to GDP in 1999 and 2006–07 were followed by major downturns in stock prices.
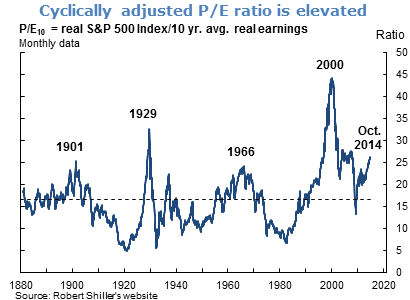
- The cyclically adjusted price-earnings ratio (P/E10) for the S&P 500 stock market index is a metric that economist Robert Shiller has advocated to help judge whether the stock market is overvalued. The ratio is computed as the real, or inflation-adjusted, value of the S&P 500 index divided by real earnings averaged over the 10 most recent years. The current P/E10 ratio of 25.7 exceeds the long-run historical average of 16.6 but remains below the values of 32.6 and 44.2 observed at the market peaks in 1929 and 2000, respectively.
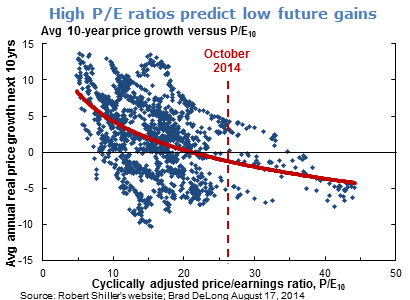
- Higher values of the P/E10 ratio predict lower future real growth in stock prices over the subsequent 10-year period. Using the average historical relationship between these two variables as a guide, a P/E10 ratio of 25.7 (the observed value in October 2014) would predict mildly negative real growth in stock prices over the next 10 years. It is important to keep in mind, however, that there are many examples in the data where the subsequent 10-year growth in stock prices turned out to be higher or lower than predicted by the average historical relationship. This reflects the inherent difficulty of predicting movements in stock prices.
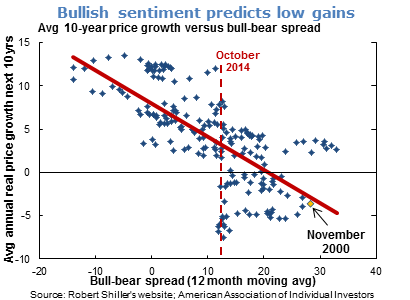
- Similar to the P/E10 ratio, a higher bull-bear spread—that is, the balance of bullish versus bearish individual investors from surveys—also predicts lower future real growth in stock prices over the subsequent 10-year period. Using the average historical relationship, the observed bull-bear spread in October 2014 would predict mildly positive real growth in stock prices over the next 10 years. Again, however, there are many examples in the data that deviate from the average historical relationship on both the upside and the downside.
The views expressed are those of the author, with input from the forecasting staff of the Federal Reserve Bank of San Francisco. They are not intended to represent the views of others within the Bank or within the Federal Reserve System. FedViews appears eight times a year, generally around the middle of the month. Please send editorial comments to Research Library.