
Reuven Glick, group vice president at the Federal Reserve Bank of San Francisco, stated his views on the current economy and the outlook as of October 8, 2015.
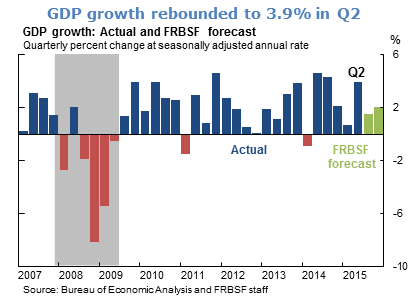
- Real GDP jumped to 3.9% in the second quarter of 2015, well above first-quarter growth of 0.6%. Personal consumption expenditures, business investment, and residential investment all made positive contributions to growth. In the six years since the Great Recession ended, real GDP growth has averaged 2.2% at an annual rate, near the economy’s long-term trend of 2%.
- We expect the U.S. economy to slow modestly in the third quarter because of reduced inventory buildups and weaker net exports. Propelled by solid momentum in consumption spending, moderate growth around the economy’s long-term trend should resume heading into 2016. Ongoing risks to the growth outlook include possible spillovers from economic slowdowns in China and other foreign markets and a further strengthening of the U.S. dollar.
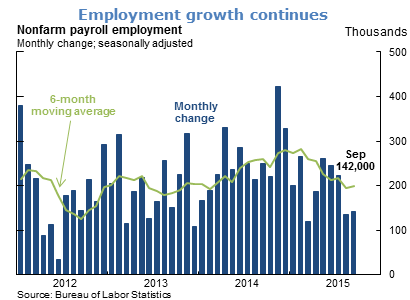
- Employment growth has slowed somewhat but remains consistent with an improving labor market. Payroll employment increased by 142,000 in September, and the number of jobs added for July and August combined was revised down by 59,000. Significant job losses were recorded in recent months for the industries most exposed to overseas conditions, the energy sector and manufacturing. Still, average gains over the past six months have been around 200,000.
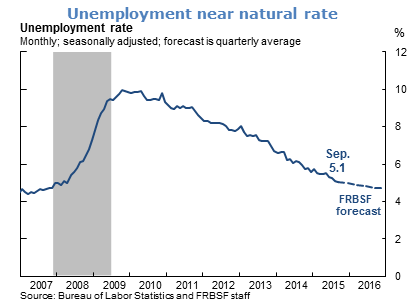
- The unemployment rate in August remained at 5.1%, which is very close to the 5.0% level that we judge to be the natural rate of unemployment. Other signs of progress include lower unemployment insurance claims and declines in broader measures of unemployment that include discouraged and marginally attached workers. However, some measures of labor market slack, such as the labor force participation rate and employment-to-population ratio, remain well below pre-recession levels. We expect that the ongoing pace of job creation, though slowing, will be sufficient to bring the economy temporarily below the natural rate in 2016.
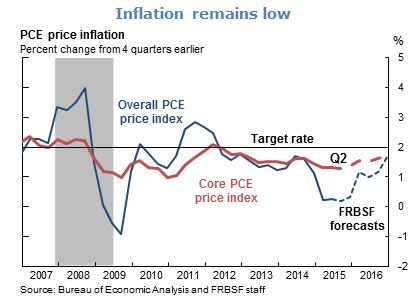
- Inflation, as measured by the change in the personal consumption expenditures (PCE) price index, was 0.3% in the 12 months through August. Very low overall inflation is largely attributable to lower prices of energy goods and services, which have fallen by over 16% in the past year. Excluding energy as well as the typically volatile food component of spending, core PCE rose 1.3% over the past 12 months. Inflation has remained below the Federal Open Market Committee’s 2% target since mid-2012. Absent further declines in energy prices or a further strengthening of the U.S. dollar, we expect that stable inflation expectations and diminishing slack will push core and overall PCE inflation up gradually towards 2%.
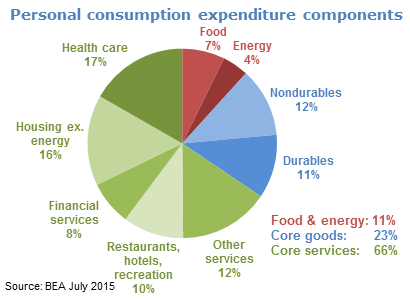
- The PCE is a composite of the price changes of different products and services. Food and energy account for roughly 11% of total consumer spending, while core goods (excluding food and energy) account for 23% of spending, and core services (excluding energy costs of housing) account for the remaining 66%.
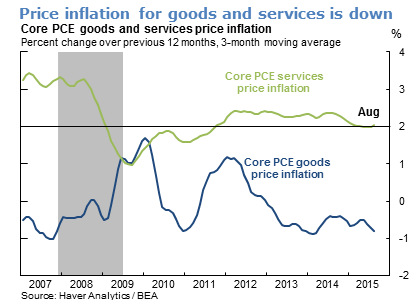
- In recent years, core services inflation has tended to be positive, except during the recession and the early recovery. Core goods inflation has tended to be negative, with brief exceptions around 2009–10 because of tobacco tax hikes and 2011–12 because of rising textile and apparel costs. In recent months both core goods and services inflation have slowed, that is, services inflation has been less positive and goods inflation has been more negative.
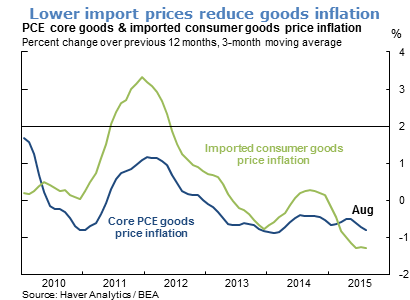
- The decline in core goods inflation can be attributed to declining import costs associated with the appreciating value of the dollar as well as lower costs abroad. Because goods account for most international trade, movements in exchange rates and foreign prices tend to exert more pressure on goods prices than on service prices. Lower prices of imported consumption goods directly affect core goods inflation. They also affect goods prices indirectly through imports of raw materials, such as metals, plastic, and rubber, used in the U.S. production of goods for domestic consumers.
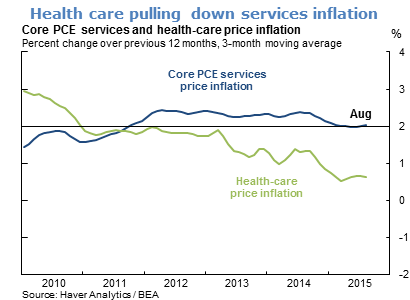
- Core service inflation has been pulled down by more subdued increases in health-care service costs, which represent a quarter of core services spending and 19% of overall core spending. Health-care services inflation has been slowing for several years and fell off sharply in 2014, primarily from capping of increases in Medicare payments to physicians.
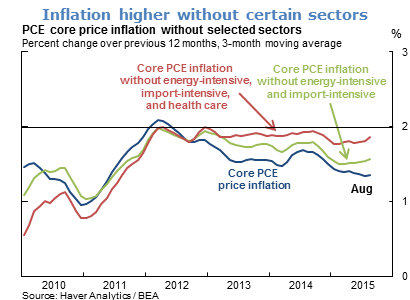
- The impact of import, energy, and health-care costs on core inflation can be gauged by “what-if” exercises that remove these sectors from the calculation. Excluding relatively import-intensive (for example, apparel and other nondurables) and energy-intensive (for example, transportation) sectors would raise core inflation modestly, by around 0.2%. Removing health-care services spending from the calculations would raise core inflation by an additional 0.3%.
The views expressed are those of the author, with input from the forecasting staff of the Federal Reserve Bank of San Francisco. They are not intended to represent the views of others within the Bank or within the Federal Reserve System. FedViews appears eight times a year, generally around the middle of the month. Please send editorial comments to Research Library.