Housing affordability is an important issue, especially in many urban areas of the West where median housing prices are far above median housing prices nationally. At the end of 2003, the nation recorded a surge in the pace of home price appreciation; fourth quarter 2003 home prices rose at their fastest pace since 1979, a factor that tends to reduce housing affordability. Still, two commonly used housing affordability indexes indicate that housing remained relatively affordable in 2003.
The first is the composite Housing Affordability Index (HAI) published monthly by the National Association of Realtors (NAR). This index measures median household income relative to the income needed to purchase a median-priced house. The second measure is the California Housing Affordability Index. Published monthly by the California Association of Realtors (CAR), this index tracks the percentage of California and national households that can afford to purchase a median-priced house.
Two key factors offset the appreciation in housing prices in recent years and contributed to the continued high level of affordability nationally. Most important, home mortgage rates were near their lowest level in decades at the end of 2003, and low rates kept the cost of home ownership low. In addition, over most of the past decade, annual increases in median family incomes have tended to outpace increases in home prices. Let’s examine the HAI index in more detail.
What is the HAI index?
This monthly housing affordability index provides a way to track over time whether housing is becoming more or less affordable for the typical household. The HAI incorporates changes in key variables affecting affordability: housing prices, interest rates, and income.1
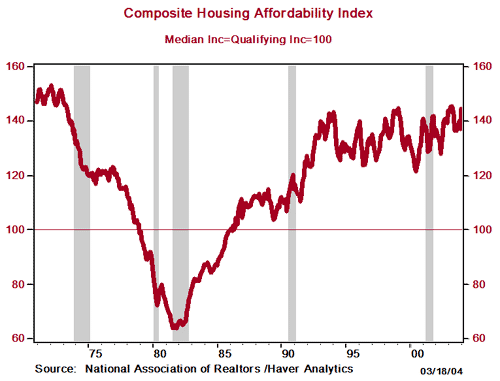
The HAI index has a value of 100 when the median-income family has sufficient income to purchase a median-priced existing home. A higher index number indicates that more households can afford to purchase a home. In December 2003, the composite HAI for the nation was 137.2, indicating that the typical household had 137.2 percent of the income necessary to purchase the typical home:
HAI = ( Median Family Income / Qualifying Income ) * 100
137.2 = ($54,115 / $39,456) * 100
Qualifying income is derived from the monthly payment on the median-priced existing home, at the effective mortgage interest rate. The HAI assumes borrowers make a 20 percent down payment and that the maximum mortgage payment is 25 percent of gross monthly income for the household.2
What does the ratio tell us?
A higher HAI ratio indicates relatively more affordability. A ratio of 100 indicates that median- family income is just sufficient to purchase the median-priced home. When the ratio falls below 100, as it did during the late-1970s and through the mid-1980s (illustrated in Chart 1), the typical household has less income than necessary to purchase the typical house. During the late-1970s through the mid-1980s, housing was relatively unaffordable. Ratios above 100 indicate that the typical household has more income than necessary to purchase the typical house. Over the ten-year period ending in 2003, the HAI shows that housing was relatively affordable nationally. The HAI averaged around 134 during the period, indicating that the typical household income was about 34 percent above the income necessary to qualify for the typical home.
CHART 1

What has been driving affordability?
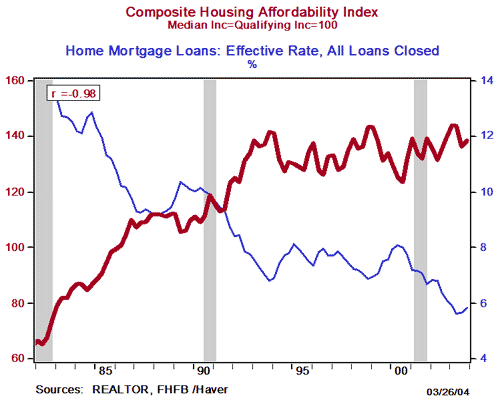
Opposing trends have been at work on housing affordability. Most important, the effective (includes interest and fees) mortgage rate (shown as the thin blue line in Chart 2—the interest rate scale is to the right on the chart) has declined, especially since 2000. Lower mortgage costs make housing relatively more affordable, and mortgage rates since 1993 have averaged less than 8 percent on an annual basis. The HAI is shown as the heavier red line in Chart 2.
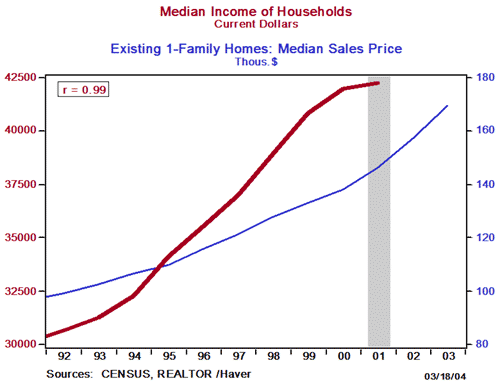
A second factor improving affordability occurs when median income rises. At least until the 2001 recession, income had been rising at a rapid pace. This is illustrated in Chart 3; the median income of households is shown as the heavy red line in Chart 3—the annual median household income scale is shown in red on the left.
Offsetting some of the positive long-term impacts of falling mortgage rates and rising household income is the surge in housing price appreciation after 1999. Median housing prices (shown as the thin blue line in Chart 3—with annual prices on the right scale), have risen throughout the 11-year period shown in Chart 3. However, since 2000 housing prices have been rising at an even faster pace than income; rising housing prices tend to reduce affordability.
CHART 2

CHART 3

Another way to measure affordability
Another popular way to measure housing affordability is illustrated by the Housing Affordability series published by the California Association of Realtors (CAR) and available on their web site.
The CAR measure of housing affordability tracks the percentage of the national and California households that can afford to buy a median-priced house. In its December 2003 Trends in California Real Estate publication, CAR reported that only 57 and 23 percent, respectively, of the nation and California’s households could afford to purchase a median-priced home.3
In this case, the major difference in affordability in December 2003 between the nation and California was housing prices; the median home price in California was $404,520, more than twice the national median home price of $173,200.
Endnotes
1. The NAR series is calculated and published on a monthly basis for the nation and four regions of the country: Northeast, Midwest, South, and West. Affordability indexes also are calculated for fixed mortgages, adjustable rate mortgages (ARMs), as well as for a composite of the two types of mortgages.
2. Monthly payments for the median priced existing single-family home are used to estimate the “qualifying income” necessary to purchase the median-priced family home. Median-home prices, published by the NAR ($174,800 for December 2003 for the nation) and effective mortgage rates, published by the Federal Finance Housing Board (5.82 percent) are used to a calculate a monthly payment ($822). The monthly payment is based on the assumptions that the buyer makes a 20 percent down payment and that the qualifying ratio for monthly housing expense to gross monthly income is 25 percent. NAR estimates median family income prior to the availability of actual data.
3. CAR estimated that only 23 percent of households in the California had the qualifying income ($94,730) necessary to purchase the median-priced home ($404,520), based a 30-year, fixed-rate mortgage (5.82 percent) with a 20 percent down payment. CAR also publishes their housing affordability index figures for the nation and key regions and counties in California.
References
Calculating the National Association of Realtors Housing Affordability Index,
http://www.realtor.org/Research.nsf/files/Formulas_HAI.pdf/$FILE/Formulas_HAI.pdf
California Association of Realtors. http://www.car.org/
National Association of Realtors. Economics and Research Division. http://www.realtor.org/research.nsf/pages/HousingInx?OpenDocument
“Trends in California Real Estate.” California Association of Realtors, Volume 25, Number 2, February 2004.