This is a great question because the Federal Reserve is placing increased emphasis on topics related to personal financial education. Understanding consumer debt and how debt levels compare across different income levels and demographic groups is very important. By investigating this data, you can learn what’s happening across the nation in terms of debt levels and see how your own debt levels compare. So, let’s get started with your questions.
Consumer Debt Increased between 1998 and 2001
According to the recently released 2001 Survey of Consumer Finances conducted by the Federal Reserve Board, just over 75 percent of all families owed some sort of debt in 2001. Not surprisingly, the most common types of debt obligations were installment loans, credit card balances, and home-secured debt.
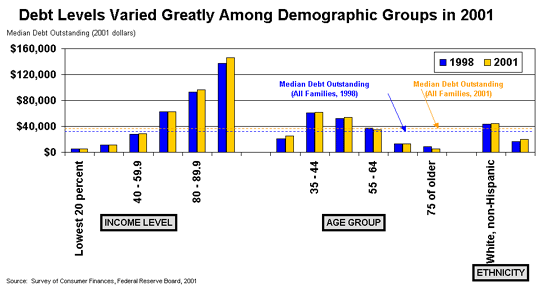
The median value1 of consumer debt obligations increased from $35,400 in 1998 to $38,800 in 2001. Specifically, there were reported increases in median balances of several categories of debt obligations including home-secured and installment loans. As shown in Chart 1, most income level groupings experienced increases in debt obligations, as did most age groups and ethnic groups.
Chart 1

Debt Burdens, However, Were a Bit Lighter Because of Increased Income
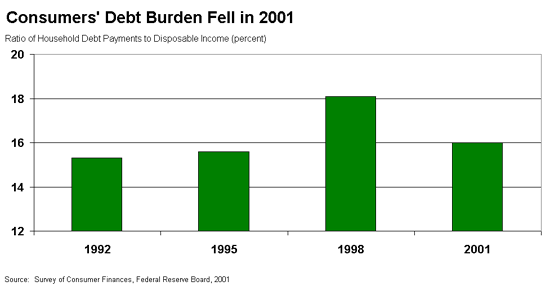
One measure of consumers’ overall debt burden is the ratio of household debt payments as a share of disposable income.2 Between 1998 and 2001, disposable income increased faster than outstanding debt and resulted in a decline in consumers’ debt burden ratio (see Chart 2).
Chart 2

Despite a decline in the overall debt burden, a significant share of families still reported debt burdens over 40 percent. This statistic indicates that at least 40 percent of a family’s monthly disposable income is used to pay bills such as the mortgage or credit cards. The 2001 survey indicated that 27 percent of families in the lowest income bracket3 reported debt burdens over 40 percent. Just imagine how difficult it would be to save if such a large share of your monthly income went to simply pay off existing bills!
Consumer Debt Remains a Concern
To summarize, median debt levels have increased, but because of asset value appreciation, personal income increases, and falling interest rates, many consumers actually have lower monthly debt payments than they did a few years ago. How, then, can we determine whether debt is excessive?
One statistic to consider is consumers’ delinquency rate for repaying bills—this can be a good indication as to how well consumers are able to handle their debt. In 2001, 7 percent of families reported at least one payment past due sixty days or more. If we assume that an average payment cycle is one month—this statistic means that 7 percent of families have at least one bill that’s two months (or more) overdue! As may be expected, this ratio is higher among families in lower income categories. Also, younger families (with a head of household under 35 years old) experienced a greater tendency to have overdue payments.
It’s important to consider that even one delinquent payment has the potential to negatively affect a consumer’s credit report. Consequently, that person may have difficulty getting a mortgage or consumer loan or have to accept a higher interest rate or additional fees on a loan he does receive.
Excessive Consumer Debt Can Make Ordinary Purchases VERY Expensive
For consumers that are unable to pay off bills in full each month, or choose to only pay the minimum payment, purchases can quickly become surprisingly expensive. For example, consider a purchase such as a stereo or new wardrobe that costs $5,000. You decide to make this purchase using a credit card, with a 14% interest rate, because you don’t have that much money available in cash to pay for the purchase. If you choose to pay only the minimum monthly payment on the $5,000 credit card balance, it would take 61 years to pay off the total purchase and you would pay almost $16,000 in interest. This means that the $5,000 stereo or wardrobe can end up costing about $21,000!
If you would like to learn more about resources that are available from the Federal Reserve System on the subject of personal finance, visit: http://www.federalreserveeducation.org/fined/.
Endnotes
1. The 1998 median debt amount is adjusted into 2001 dollars to account for inflation and to make the 1998 and 2001 values comparable.
2. The debt-service burden is the ratio of household debt payments to disposable income. The measure combines required payments on revolving debt (with an assumed required minimum payment of 2 ½ percent of the balance per month) and closed-end debt. For more information about the calculation of this ratio, see http://www.federalreserve.gov/releases/housedebt/about.htm.
3. The lowest income bracket represents the lowest 20 percent of family incomes. Median annual income for this group of families in 2001 was $10,300.
Additional Resources
Aizcorbe, Ana M., Arthur B. Kennickell, and Kevin B. Moore. “Recent Changes in U.S. Family Finances: Evidence from the 1998 and 2001 Survey of Consumer Finances.” Federal Reserve Bulletin. January 2003. Available at:
http://www.federalreserve.gov/pubs/bulletin/2003/0103lead.pdf.
Braunstein, Sandra, and Carolyn Welch. “Financial Literacy: An Overview of Practice, Research, and Policy.” Federal Reserve Bulletin. November 2002. Available at:
http://www.federalreserve.gov/pubs/bulletin/2002/1102lead.pdf.
Velde, Francois. “The Household Balance Sheet – Too much debt?” Chicago Fed Letter. September 2002. Available at:
http://www.chicagofed.org/publications/fedletter/2002/cflsept2002_181a.pdf.
“What steps can be taken to increase savings in the United States economy?” Ask Dr. Econ. February 2002. Available at:
/education/activities/drecon/2002/0202.html.