I am so glad you asked this great question! Indeed, many of us study economic theory in classrooms, and the Phillips curve is typically covered in a macroeconomics class. However, it is natural to wonder whether the theories we learn in class are supported by current data and whether they are used by current policymakers.
The discussion of the Phillips curve is particularly relevant to thinking about central bank actions. You may have noticed that many financial publications talk about central banks’ attempts to boost or slow the pace of economic activity. Such discussions frequently also touch on the impact of the central banks’ actions on inflation, drawing on the proposed inverse relationship between inflation and unemployment that is known as the Phillips curve (after its discoverer, A.W. Phillips).
A Brief History of the Phillips Curve for U.S. Data
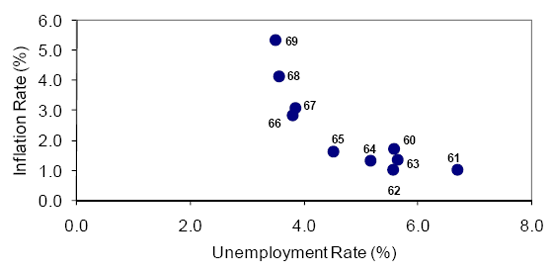
In 1958, a researcher by the name A.W. Phillips published a paper in which he showed, using British data, that years of high unemployment rates tended to coincide with steady or falling wages and years of low unemployment rates were also years of rising wages. Because wage and price inflation move together, Phillips’ finding can be extended to the relationship between price inflation and the unemployment rate. The annual U.S. data for the 1960s actually shows that relationship rather clearly (see Figure 1).
Figure 1. U.S. Consumer Price Index (CPI) Inflation and Unemployment Rates
in the 1960s.

Data Source: U.S. Bureau of Labor Statistics
The original concept of the Phillips curve implied that policymakers could maintain a lower unemployment rate forever, as long as they were willing to pay the price of a higher inflation rate. This concept was soon challenged by a group of economists called monetarists,1 led by Milton Friedman, Karl Brunner, and Allan Meltzer. Milton Friedman (1967) and Edmund Phelps (1968) argued that the concept of the Phillips curve does not apply to the long run (that is, a period long enough for the participants in the economy to become fully aware of aggregate prices and inflation).2 In the long run, monetarists argued, price changes will have no impact on the unemployment rate, because the unemployment rate will equal its “natural” rate such that price and wage decisions are consistent; another way to think about this is that it is the level of unemployment towards which the economy tends to gravitate as it adjusts to any rate of inflation.3 In other words, the monetarists argued that the long-run Phillips curve is vertical at the natural rate of unemployment.
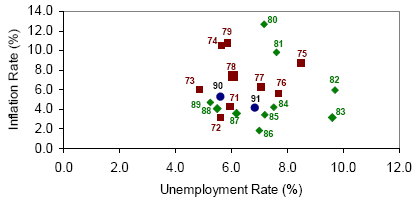
While many economists at the time believed that the Phillips curve was a stable relationship and did not subscribe to the monetarists’ point of view, the situation changed in the 1970s. Indeed, while the data in the 1960s clearly supported the idea of a Phillips curve (as shown in Figure 1), the post-1970s data were quite different. As shown in Figure 2, in the next two decades the data did not show a smooth relationship between inflation and unemployment in the long run. However, these data did show that the possibility of a short-run trade-off remained. As a result, the distinction between the short-run and the long-run Phillips curves was born. The short-run Phillips curve began to include expected inflation as a determinant of current inflation and, therefore, was labeled the “expectations-augmented Phillips curve.”
Figure 2. U.S. CPI Inflation and Unemployment Rates in 1971-1991

Data Source: U.S. Bureau of Labor Statistics
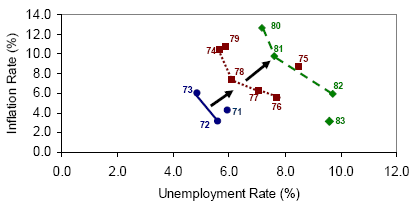
If you look carefully at Figure 2, you might notice three somewhat smooth Phillips curves are hiding: one for 1971-1973, one for 1974-1979, and one for 1980-1983. I have traced those Phillips curve for you in Figure 3:
Figure 3. Phillips Curve Shifts During the 1970s and Early 1980s.

Data Source: U.S. Bureau of Labor Statistics
As you can see, the Phillips curve appears to have moved to the right during the period discussed. One possible explanation for this could be an upward shift in inflation expectations from the early ’70s to the early ’90s. In addition, you might recall that another development took place in the 1970s: large supply shocks, one in 1973 and another in 1979. These two shocks coincide very well with the two shifts in the Phillips curve shown in Figure 3. It appears that the shifts were caused by both upward revisions to inflation expectations and negative supply shocks. Thus, by the early ’90s, the concept of the short-run Phillips curve included not only expected inflation, but also supply shocks.
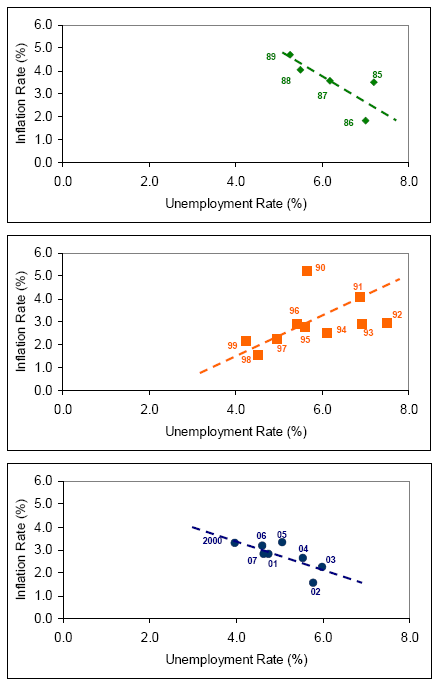
Finally, let’s look at the most recent data. Figure 4 shows the data for 1985-2007, divided into three subperiods. The figure might be interpreted as suggesting a downward relationship between inflation and unemployment in the 1980s and 2000s (steeper in the 1980s and shallower in the 2000s), but an upward relationship in the 1990s. However, an upward relationship contradicts the Phillips curve theory of a tradeoff between unemployment and inflation. There are several explanations for why the 1990s were characterized by both lower inflation and falling unemployment rates. One has to do with increased competition in many U.S. industries, which kept producers from increasing prices as much as they would have in the absence of tight competition. Other possible explanations include a more successful monetary policy regime that reduced people’s expectations of future inflation, demographic shifts in the labor force,4 and changes in worker productivity (Lansing 2002).
Figure 4 U.S. CPI Inflation and Unemployment Rates in 1985-2007

Data Source: U.S. Bureau of Labor Statistics
To summarize, the modern Phillips curve tells us that inflation is guided by three forces: expected inflation, the deviation of unemployment from its natural rate (sometimes referred to as the unemployment gap), and supply shocks. All other things being equal, an increase in expected inflation is expected to exert upward pressures on inflation. The same goes for unemployment falling below its natural rate and positive supply shocks, such as reductions in the relative prices of energy, food, or imports.
Who Uses the Phillips Curve?
Many economists believe that the Phillips curve is a very useful relationship because both inflation and unemployment are key measures of economic performance. Monetary policymakers tend to use the Phillips curve framework quite a bit, as can be demonstrated by the following quotes:
A model in the Phillips curve tradition remains at the core of how most academic researchers and policymakers—including this one—think about fluctuations in inflation; indeed, alternative frameworks seem to lack solid economic foundations and empirical support. Donald Kohn, Vice Chairman of the Board of Governors of the Federal Reserve System
The truth is that the Philips Curve, in its modern, expectations-augmented form, was the single most stable and useful econometric tool in a forecaster’s arsenal for most of the last fifteen years. Laurence Meyer, Former Federal Reserve Board Governor
To project core inflation at longer-term horizons, the staff consults a range of econometric models. Most of the models used are based on versions of the new Keynesian Phillips curve, which links inflation to inflation expectations, the extent of economic slack, and indicators of supply shocks. Ben Bernanke, Federal Reserve Chairman
There is some evidence that the Phillips curve inflation forecasts outperform some other, more complicated models
A potential drawback of the simple Phillips curve model for analyzing and forecasting inflation is that it does not explicitly incorporate the possible influence of labor costs on the inflation process. The Board’s large macroeconomic simulation model, known as FRB/US, projects inflation through a system approach that captures the interaction of wage and price determination. Interestingly, however, the system approach does not seem to forecast price inflation as well as single-equation Phillips curve models do. Ben Bernanke, Federal Reserve Chairman
Yet, this is not to say that the Phillips curve framework is without fault or that it captures the data perfectly. For instance, some have cautioned that the framework may not be complex enough to capture all the intricacies of today’s economies:
The ultimate lesson that I draw from the vicissitudes of the Phillips curve in the half of a century behind us is that we should all beware of models that short-circuit the workings of a complex market economy in a single equation. Jürgen Stark, Member of the Executive Board of the Eurpoen Central Bank – (ECB)
Others have pointed out that the Phillips curve may not be as useful for forecasting inflation as conventional wisdom suggests:
Our result contrasts sharply with the conventional wisdom. We find that over the last 15 years, all three sets of NAIRU Phillips curve–based inflation forecasts have been no more accurate than the forecast from our naive model, that inflation over the next year will be equal to inflation over the previous year. We conclude that NAIRU Phillips curves are not useful for forecasting inflation. Andrew Atkeson and Lee E. Ohanian,
Visiting Scholars at the Federal Reserve Bank of Minneapolis and Professors of the UCLA Department of Economics
As you can see, economists and policymakers are far from speaking with one voice on the usefulness and validity of the Phillips curve framework. The topic has been one of the most controversial ones in macroeconomics for a few decades now. Yet, the relationship between inflation and unemployment is probably one of the most important ones that macroeconomists think about.
This short answer is not meant to be a comprehensive one. I encourage you to do some of your own research on the topic. Here are some suggestions for further readings:
- The Federal Reserve Bank of Boston held a conference that centered around the Phillips curve and its implications for monetary policy, titled “Understanding Inflation and the Implications for Monetary Policy: A Phillips Curve Retrospective.” You can go to the conference’s web site to see the agenda and papers presented:
- “Fed in Print” is a comprehensive index of Federal Reserve economic research. You can search for Federal Reserve publications that discuss the Phillips curve.
- You can also search the web page of the Federal Reserve Board of Governors for references to the Phillips curve. Using the advanced search feature, I suggest you either search in Speeches / Testimony or Discussion Papers.
End Notes
2. Therefore, in the long run, expected inflation is equal to actual inflation.
3. Frequently, the natural rate of unemployment is also referred to as Non-Accelerating Inflation Rate of Unemployment or NAIRU. To read more about NAIRU and its usefulness to monetary policy, please refer to Judd 1997. Although the two terms are frequently used as synonyms, they are not exactly the same and some economists caution that it is important to distinguish between the two (for more details see Walsh 1998).
4. The argument goes that, from the mid-1960s to the late 1970s, teenage baby boomers comprised a considerable portion of the population. Unemployment rates for teenagers are higher than for other groups in the labor force. Thus, unemployment rates during those years tended to be higher. By the 1990s, the share of teens in the overall labor force fell (because baby boomers aged and fewer people were born during the 1970s and early 1980s). As a result, the unemployment rate fell.