Dr. Econ, in your May 2013 answer, you mentioned that the unemployment rate alone may not fully capture the overall picture of labor market conditions and that policymakers look at a range of labor market indicators to make monetary policy decisions. Could you tell me about those other indicators?
Answer:
Labor market conditions indeed are prominent in the monetary policy deliberations of the Federal Reserve’s Federal Open Market Committee (FOMC). As I discussed in May 2013 (link), the FOMC statements refer to a threshold value of the unemployment rate as part of the information the Committee will watch closely. This will play into their decision of when to begin lifting the federal funds rate target from its current near-zero lower limit. The Committee has also indicated that it will continue its current large-scale asset purchase program, better known as QE3, “until the outlook for the labor market has improved substantially in a context of price stability.” (See the most recent FOMC statement.)
Chairman Bernanke provided additional guidance regarding asset purchases and labor market conditions at the press conference following the release of the June 19, 2013, FOMC statement:
Well, there are many factors that we look at when trying to judge the state of the labor market. As you know, we look at participation, payrolls, a variety of other data, but the 7% unemployment rate is indicative of the kind of progress we’d like to make in order to be able to say that we’ve reached substantial progress.
Why is the unemployment rate important for monetary policy decisions?
The objectives Congress gave the Fed for monetary policy are “maximum employment, stable prices, and moderate long-term interest rates.” Thus, it is natural that labor market conditions would be a part of monetary policy deliberations. Indeed, as Chairman Bernanke said, FOMC participants look at a number of indicators, including labor force participation, nonfarm payroll employment, and the unemployment rate, which are all published by the Bureau of Labor Statistics or BLS.
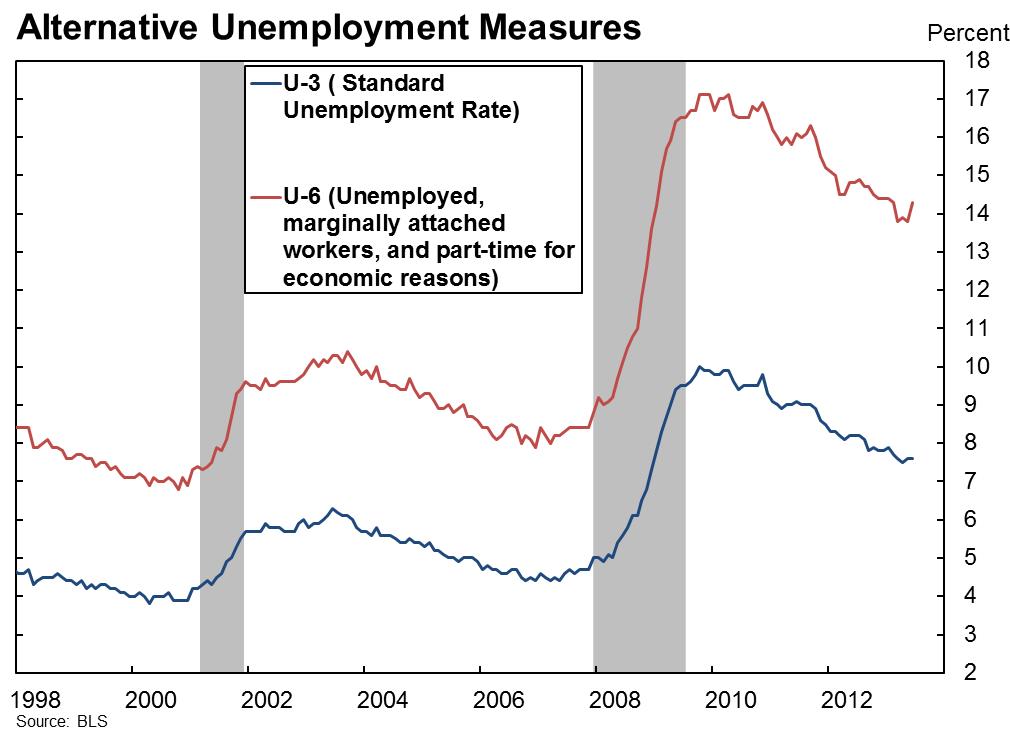
While the monetary policy mandate is phrased in terms of full employment, the unemployment rate typically is a reliable indicator of labor market conditions. The official unemployment rate commonly quoted is the U3 measure, which is the ratio of unemployed people (16 or older, actively searching for work) to the civilian labor force. The labor force includes employed workers and those searching for jobs but excludes the military. There are other measures, such as the U6 unemployment rate, which adds the underemployed to the U3. Specifically, U6 includes people who work part-time involuntarily—that is, they would prefer to work full-time. It also includes people who for various reasons are not searching for a job but would like to work. While the levels of U3 and U6 unemployment differ, their movements through times of economic growth and contraction tend to be highly correlated (see Figure 1).
Figure 1. Alternative Unemployment Measures Are Highly Correlated.
The official unemployment rate also tends to be highly correlated with the employment-to-population ratio, measured as the ratio of employed adults (16 or older) to the adult population (Levin and Erceg 2013). Figure 2 plots the unemployment rate and the employment-to-population ratio for the past 30 years (recession periods are shaded gray). As the figure shows, the unemployment rate mirrors the employment-to-population ratio much of the time. Some differences between the two rates arise from changes in the labor force participation rate. However, as Figure 2 shows, most of the movement in the participation rate does not appear to be cyclical, or related to the business cycle. Rather, it tends to be more secular, or related to other influences such as increased participation of women in the labor force and slower-moving demographic changes. The figure also shows that the unemployment rate has been highly negatively correlated with the employment-to-population ratio (-0.95 for the period shown in Figure 2) and thus has been a reliable measure of cyclical changes in the labor market.
Figure 2. Recent Declines in the Unemployment Rate Are Driven by the Drop in the Labor Force Participation Rate (Rather Than Improvements in the Employment-to-Population Ratio)
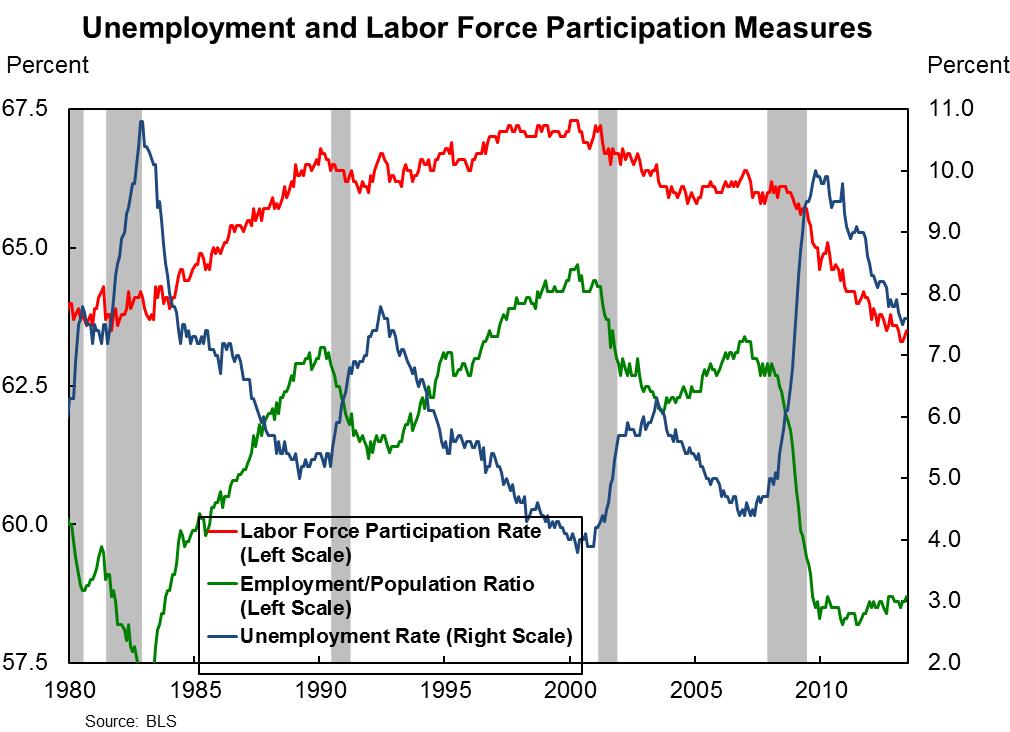
Since 2010, however, the unemployment rate has fallen while the employment-to-population ratio has remained fairly steady. This divergence has raised the question of whether the unemployment rate is still providing an accurate picture of labor market conditions in the current recovery. In particular, the concern is that the decline in the unemployment rate may overstate labor market improvement, given the modest rise in the employment-to-population rate.
This marked divergence in the unemployment rate and the employment-to-population ratio in the current cycle reflects movements in the protracted decline in the labor force participation rate. As shown in Figure 2, the participation rate has fallen substantially in the current cycle especially since the end of the most recent recession (the last gray bar). Labor force participation declined from 66.4% at the start of 2007 to 63.4% in July 2013.
At the heart of the debate about the unemployment rate’s reliability is the question of whether the decline in labor force participation is more secular or cyclical. If the decline is mainly secular, then the unemployment rate likely remains reliable. On the other hand, if most of the decline in the participation rate is related to the business cycle, then the unemployment rate declines overstate improvement in labor market conditions.
So what is the answer—secular or cyclical? Probably some of each. Some of this decline can be attributed to demographic changes, such as baby boomers aging and leaving the labor force, that have been taking place for some time. These demographic changes are not related to the 2007-09 recession and the slow pace of the recovery. However, recent research shows that the decline in the participation rate is likely larger than one would expect if only these kinds of structural forces were at play (see Bengali, Daly and Valletta 2013). Part of what is going on is that unemployed people, frustrated by unsuccessful job searches, likely have given up actively searching for work. This would cause a decline in both the labor force participation rate and the unemployment rate, while having no impact on the employment-to-population ratio. As a result, the official unemployment rate might not adequately capture the current labor market situation. In the words of Chairman Bernanke, discussing a similar situation in 2004:
The tendency of recent job losers to leave the labor force likely masks some of the effects of job cuts on the unemployment rate, so that the current measured level of unemployment may understate the extent of job loss or the difficulty of finding new work.
To the extent that the decline in the participation rate has been cyclical, it has implications for the unemployment rate in the future. As of mid-year 2013, the economy had strengthened and demand for labor had picked up somewhat. Yet, some of those frustrated workers who left the labor force for a while might decide that the prospects of finding a job have improved enough to resume their job search and re-enter the labor force. This could cause an increase in the labor force that would damp the decline in the unemployment rate, even as the economy adds jobs. Thus, the unemployment rate outlook also depends on the evolution of the labor force participation rate. For a discussion of alternative scenarios for the labor force participation rate and unemployment rate projections, watch this short video.
Are there other important labor market indicators?
Along with unemployment, labor force participation, and payroll employment, the FOMC monitors other labor market indicators. For instance, in a March 2013 speech, Federal Reserve Vice Chair Janet L. Yellen said the unemployment rate and payroll employment growth are the primary indicators she looks at when thinking about the labor market outlook, but she also mentions the hiring and quit rates:
In addition, I am likely to supplement the data on employment and unemployment with measures of gross job flows, such as job loss and hiring, which describe the underlying dynamics of the labor market. For instance, layoffs and discharges as a share of total employment have already returned to their pre-recession level, while the hiring rate remains depressed. Therefore, going forward, I would look for an increase in the rate of hiring. Similarly, a pickup in the quit rate, which also remains at a low level, would signal that workers perceive that their chances to be rehired are good—in other words, that labor demand has strengthened.
I also intend to consider my forecast of the overall pace of spending and growth in the economy. A decline in unemployment, when it is not accompanied by sufficiently strong growth, may not indicate a substantial improvement in the labor market outlook. Similarly, a convincing pickup in growth that is expected to be sustained could prompt a determination that the outlook for the labor market had substantially improved even absent any substantial decline at that point in the unemployment rate.
In January 2013, St. Louis Fed President James Bullard discussed the importance of keeping track of part-time vs. full-time employment and job quality, among other indicators:
Other labor-market indicators that the FOMC examines include measures of hours worked, which address part-time vs. full-time employment. Changing practices in labor markets could bring more people into part-time and temporary work; from that point of view, hours might be a better indicator of the state of the labor market than simply counting the number of jobs. The quality of jobs is also an important aspect of the health of the labor market. For instance, measures of hours worked and the number of jobs could be good, but policymakers may not like the mix of jobs because many of them are low-wage. In addition, the FOMC considers data from the Job Openings and Labor Turnover Survey (JOLTS) in assessing the labor market. The list goes on.
To give another example, San Francisco Fed President John Williams has mentioned two indicators that provide signals about future labor market conditions: initial unemployment claims and the percentage of people who say in surveys that it’s hard to find a job.
What are FOMC members’ current opinions of the state of the labor market?
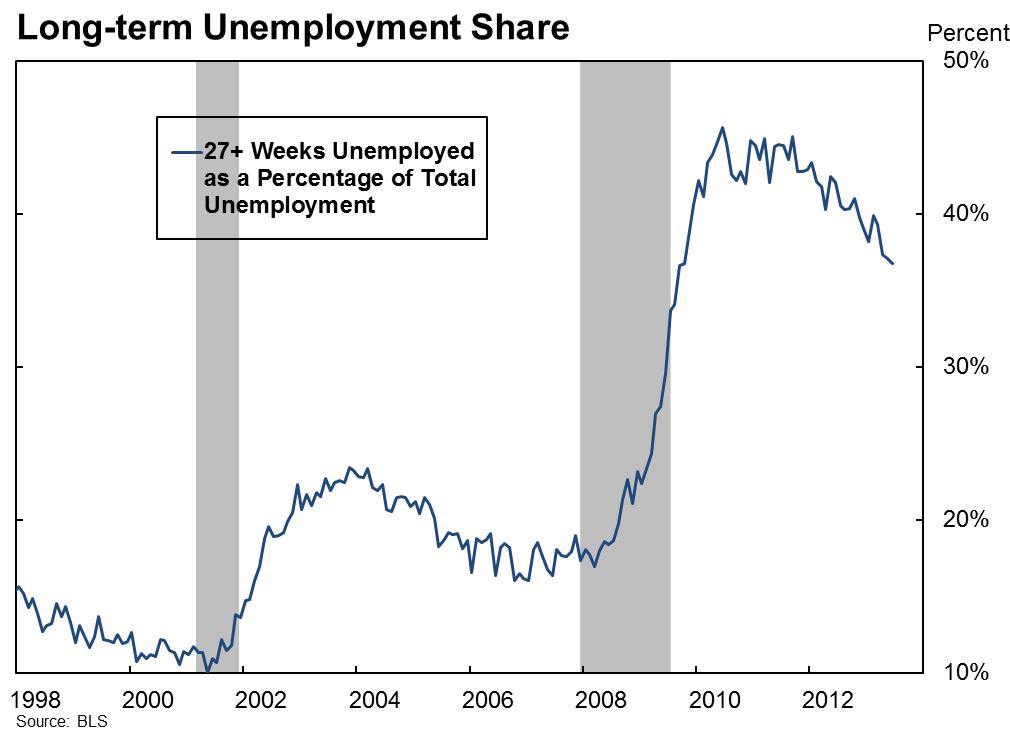
Consistent with some of the individual opinions I’ve mentioned, FOMC minutes from the June 18-19, 2013, meeting also mention the unemployment rate, employment growth, duration of unemployment, the mix of part- and full-time workers, and forward-looking indicators of near-term labor market activity such as household expectations of the labor market situation, initial claims for unemployment insurance, job openings data, and the rate of gross private-sector hiring. FOMC members have described gains in nonfarm payroll employment as “considerable.” They also have cited increasing monthly gains in private employment (Figure 3), the breadth of job gains across industries, the decline in layoffs (Figure 3), and a rise in voluntary quits in some industries as encouraging signs. However, some FOMC participants also mentioned that no apparent increases in wage pressures, the continuing elevated level of long-duration joblessness (Figure 4), and the weakness in labor force participation (Figure 2) are signs that the labor market may not have improved as much as implied by the unemployment rate drop.
As you can see, policymakers routinely review and analyze a wide variety of labor market indicators to provide a better understanding of current and future trends. Needless to say, this is a complicated job, because at times these indicators give conflicting signals. Moreover, as the economy changes, different indicators might become more informative. As a result, policymakers adjust their focus on different indicators. The situation in mid-2013 is a good example of a time when mixed labor market signals raised uncertainty about how reliable the information content of these indicators was.
Figure 3. Gains in Total Nonfarm Payroll Employment and Reduced Layoffs and Discharges Signal Improvement in Labor Markets.
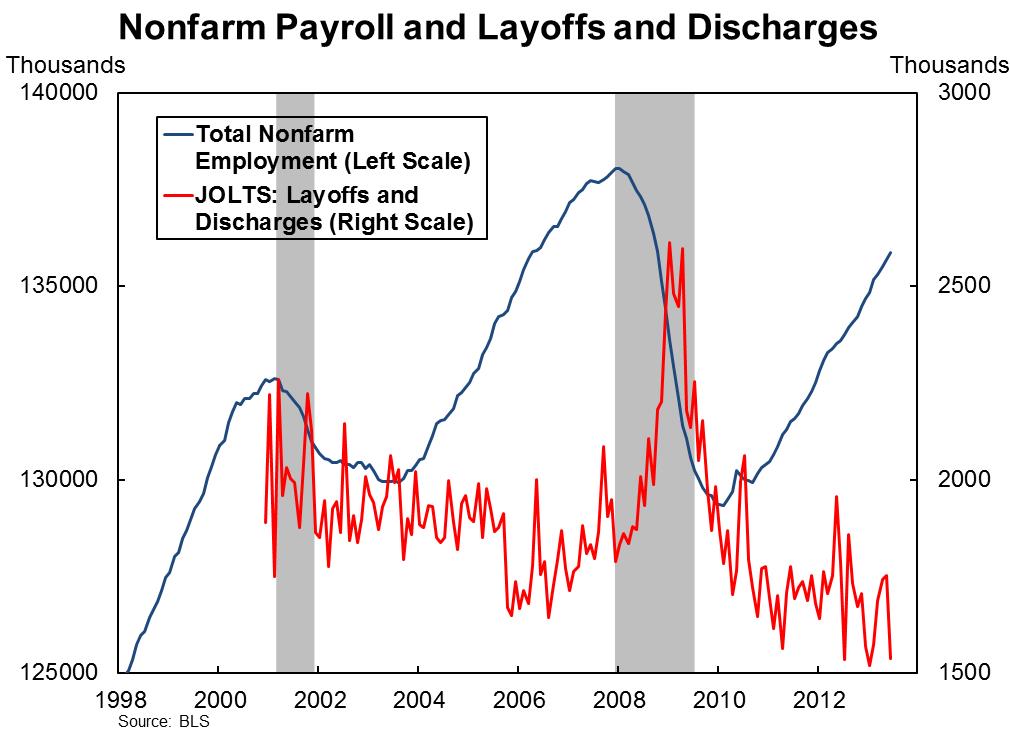
Figure 4. The Share of the Long-Term (6 months +) Unemployed Remains Very High by Historic Standards
How can I follow the data that you discussed?
For additional clues on the labor market indicators FOMC members consider important over time, you may want to review their speeches and testimony:
- Speeches and testimony of the Governors and Chairman
- FOMC statements, minutes, projections, Chairman’s press conference, and related information
- FRBSF Presidents’ Speeches
- Visit other Reserve Bank’s websites for each Reserve Bank Presidents’ speeches
Most of the data I mentioned are available from the Bureau of Labor Statistics:
- Employment, unemployment, employment-to-population ratio, labor force participation rate, duration of unemployment, and information on full-time, part-time, and discouraged workers can be found in the Employment Situation Report on a monthly frequency
- Information on monthly job openings, hire and quit rates can be found in the Job Openings and Labor Turnover Survey (JOLTS)
The data on unemployment insurance claims is available from the United States Department of Labor. You can find it in the Unemployment Insurance Weekly Claims Report.
Additional Resources:
Bengali, Leila, Mary Daly, and Rob Valletta. May 2013. “Will Labor Force Participation Bounce Back?” FRBSF Economic Letter 2013-14.
Bullard, James. January 2013. “The Fed’s Latest Balance-Sheet Policy: What Constitutes Substantial Labor-Market Improvement?” The Regional Economist.
Federal Reserve Bank of San Francisco. June 2004. “Ask Dr. Econ: Why Does the Federal Reserve Consider Nonfarm Payroll Employment to be an Important Economic Indicator?”
Jorda, Oscar. April 2013. “Will the Unemployment Rate Stall in 2013?” FRBSF Economics in Person Series.
Williams, John W. June 2013. “The Economic Recovery: Past, Present, and Future.” Speech to the Sonoma County Economic Development Board.
Yellen, Janet. March 2013. “Challenges Confronting Monetary Policy.” Speech at the 2013 NABE Economic Policy Conference.