It’s a pleasure to participate in this year’s Monetary Policy Forum. I am particularly pleased to be discussing today’s paper. The authors have done an excellent job of analyzing and illuminating a key sector that has had profound effects on the economy, effects that policymakers have been wrestling with. I appreciate the opportunity to offer some thoughts on these issues.
The paper makes a compelling case that the housing boom and bust are central for understanding both the depth of the recession and the slow recovery. Indeed, the housing bust has led to a persistent shortfall in aggregate demand, through a variety of channels.2 The authors also argue that problems in housing have affected the transmission of monetary policy.
In my comments today, I will focus on two issues. First, I will argue that, although the collapse in home prices and residential construction has been an important part of the story, it has not been the only factor weighing on aggregate demand. In particular, the sluggish recovery has not been limited to regions hard-hit by the housing downturn. Instead, fallout from the broader financial crisis also reduced aggregate demand through a variety of nonhousing channels. Second, the resulting large and persistent output gap is national in scope, which calls for strong countercyclical monetary policy.3 After saying that, I should make clear that I am speaking for myself and not for others in the Federal Reserve System.
The title of the paper is “Housing, Monetary Policy, and the Recovery.” The discussion and figures in the first half of the paper are, indeed, focused on housing and the recovery. But the authors then shift to quantifying that the downturn was more severe in states that had larger declines in home prices. This analysis, along with Amir Sufi’s work with Atif Mian and others,4 sheds light on the important role of housing in exacerbating the downturn. But the authors do not say much about the recovery phase, which has been anomalous compared with recoveries from past deep recessions.
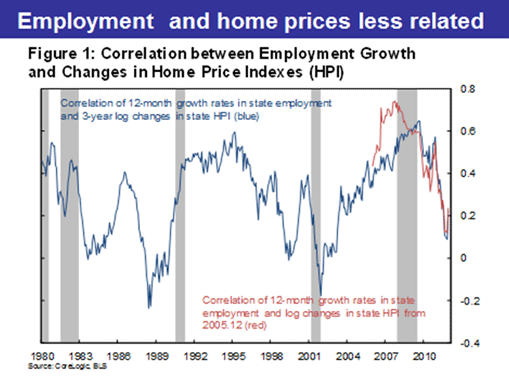
This distinction matters. The link between house prices and regional economic activity is much clearer in the downturn than in the recovery. That point comes through in the next two figures, one looking at house prices and employment, and the other housing starts. Figure 1 shows the evolution of the cross-sectional correlation between state-level employment growth and changes in house prices. The blue line shows the monthly correlation across states between the 12-month change in employment and the 36-month change in home prices. The red line also uses the 12-month change in employment, but measures the change in home prices relative to a fixed starting point at the end of 2005. Both lines tell the same story. States with larger declines in home prices also had larger declines in employment during the downturn. But this correlation has largely vanished during the recovery. In 2011, the pace of employment growth was similar for states that had large home price declines and those that did not.
We see the same pattern in housing starts. The downturn was more severe in states that had larger home price declines. But starts have been more similar during the recovery. The two bars on the left of Figure 2 show the states that had higher-than-average home price declines. The blue bar shows the downturn, measured as the level of starts in the second quarter of 2009 relative to the fourth quarter of 2005; the red bar, the recovery, measured as starts in the fourth quarter of 2011 compared with the second quarter of 2009. The right bars do the same for states with smaller price declines, or, in a few cases, increases.
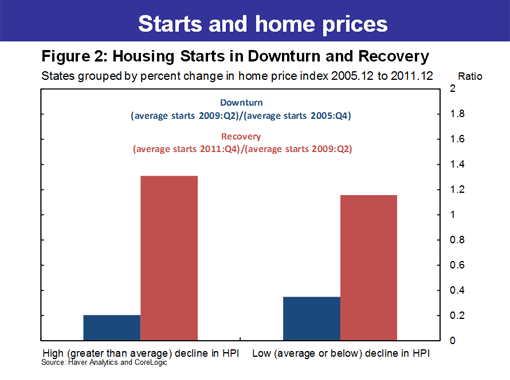
During the recession, starts plunged everywhere. But the contraction was larger in high-price-decline states, where starts fell by a factor of five. Moreover, from 2009 to 2011, there was only limited recovery anywhere. In fact, the recovery was actually slightly stronger in the hardest-hit states. Thus, housing was important in explaining regional differences during the downturn. But once the downward adjustments took place, the disappointing pace of recovery has been similar across regions, suggesting broad-based factors have been at work.
This evidence supports the view that house-price declines were not the entire story behind the deep recession and slow recovery. Following on that point, the analysis in this paper is best viewed in the context of the financial crisis more generally. Certainly, few would dispute that the housing collapse was a critical factor in triggering the broader financial crisis. For example, Gary Gorton and others have argued for the central role of concerns about the valuation of private-label MBS.5 And, housing-related losses at financial institutions impaired credit availability. But these and other dimensions of the financial crisis caused broad additional effects on aggregate demand. These effects went beyond those due simply to reduced spending by overleveraged households.
This point is illustrated by a careful examination of the timing of the downturn. Figure 3 shows that house prices peaked in 2006 and had fallen about 20 percent by the time Lehman Brothers failed in September 2008. Housing starts had already fallen sharply, but effects on nonhousing indicators were relatively modest. The stock market, though off its highs, was still about where it had been when home prices peaked. And the economy was bearing the housing crash reasonably well. In many ways, it looked like a replay of the recession following the dot-com bust.
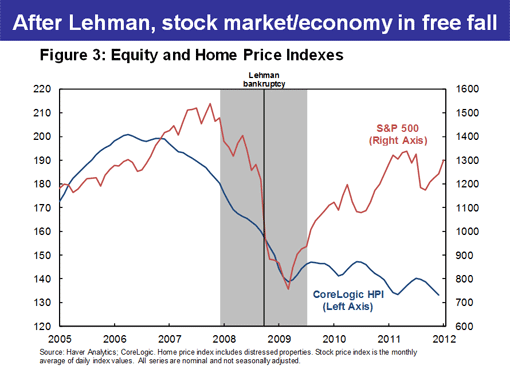
In contrast, after Lehman, the stock market and the real economy both went into free fall. We saw a massive flight to quality, increased demand for liquidity, greater uncertainty and compensation for risk, and widespread impairment in financial market functioning. These financial market effects have been important factors in the economy’s performance during the recession and recovery. And, of course, the current European crisis is certainly not the result of overleveraged U.S. households, at least not directly.
In this regard, it is interesting to look at analysis of the housing market presented to the Federal Open Market Committee back in June 2005.6 In my presentation at that meeting, I used the Board of Governors FRB/US model to examine the effects of a 20 percent decline in home prices. The model did not explicitly incorporate the types of deleveraging and credit constraint channels highlighted by the paper. However, I did include additional spillovers to aggregate demand and bond premiums to get at some of the imbalances present at the time. The model simulation implied that the downturn would be relatively modest, though requiring a sizeable monetary response. For example, with a Taylor rule, the fed funds rate would fall about three percentage points and the unemployment rate would rise by about one percentage point following the shock.
Until Lehman, the predictions of that model held up reasonably well. For example, in August 2008, home prices had fallen almost exactly 20 percent from their peak. The fed funds rate had been cut from 5¼ percent to 2 percent, and the unemployment rate had risen a little more than one percentage point to 6.1 percent. According to this analysis, if the housing crash had not ignited the financial crisis, the macroeconomic effects would not have been disastrous.
Then came the financial crisis. The economy plunged into nearly the worst recession since World War II. Of course, the model simulations did not foresee the global financial crisis, with its demand for safety and liquidity, the seizing up of markets, and the effects of these developments on confidence and aggregate demand. And it is the aftereffects of those events that are playing a major role in restraining the recovery even today.
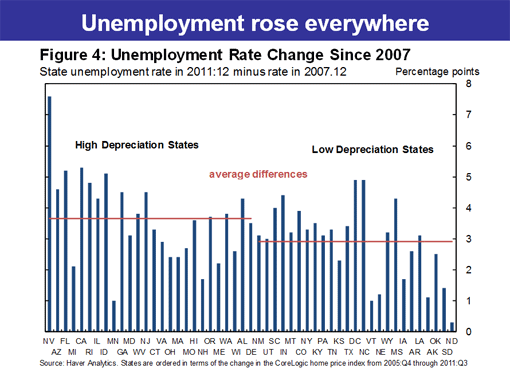
In looking at the relative role of the decline in house prices versus the broader downturn following the financial crisis, it is important to note that the downturn was severe even in places with smaller house-price declines. Housing starts and employment fell everywhere. Even today, the unemployment rate in every state remains higher than it was before the Great Recession, as shown in Figure 4. The unemployment rate rose more in states with above-average house-price declines. But the increases were also substantial in most states that had smaller-than-average house-price declines.
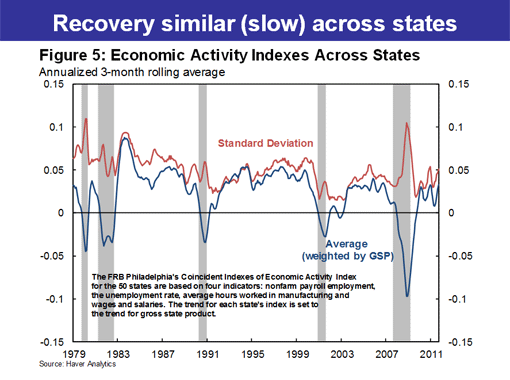
Not only did almost every state suffer from the downturn, but the recovery has been fairly similar across regions. Figure 5 depicts a measure of dispersion from state coincident indexes of economic activity.7 The red line shows that, in the Great Recession, the standard deviation across states rose substantially. But, since the recovery began, the standard deviation has been relatively low. Other indicators, such as employment growth, do not show unusual dispersion across states. This evidence suggests that there hasn’t been a significant difference in growth between high- and low-price-decline states during the recovery. The slow pace of recovery since 2009 has been widespread, which reflects common obstacles to growth across all states. Some of these headwinds are clearly related to housing and household balance sheets. Others are only indirectly related, including tight credit, pervasive economic uncertainty, and weak global conditions.
What about monetary policy then? The paper’s executive summary notes that current “headwinds…may require a more aggressive monetary response than in normal downturns.” I entirely agree.
A notable policy challenge is that the reduction in household and business demand has pushed us to the zero lower bound on the federal funds rate. A range of monetary policy rules suggest that the target nominal funds rate should have been substantially negative in recent years.8 Another challenge is that the monetary transmission mechanism is partially clogged. Credit market frictions make refinancing and other housing activity less responsive to changes in interest rates. Fortunately, the monetary transmission mechanism doesn’t work solely through its effects on housing, or even through balance sheets and collateral constraints more generally. Monetary policy also affects the economy through wealth effects, household intertemporal substitution, the user cost of capital generally, and exchange rates, among other mechanisms.9
But suppose monetary policy is less powerful than usual. That suggests we need to move our monetary instruments even more than usual to achieve our employment and price-stability objectives. The paper hints at a potential caveat to this argument: sector- or region-specific capacity constraints. For example, because of the different housing markets, monetary policy might be potent in Kansas, but less so in Nevada. By attacking a big output gap in one region, we could be overheating other regions. This concern is largely hypothetical. It’s not the case that some areas are overheating and others are languishing. Every region is facing substantial common headwinds.10
Now, the partially clogged transmission mechanism could suggest that you don’t do more of everything across the board, but concentrate on policies that affect particular problem areas. For example, purchases of mortgage-related securities appear to have reduced mortgage rates significantly, making them particularly useful given the weakness in the housing sector.11 In addition, as discussed in the paper, fiscal policies could directly address the housing-related headwinds, potentially yielding two benefits—a stronger housing recovery and more powerful effects from the existing monetary stimulus.12
To conclude, housing is a major factor in the deep downturn and sluggish recovery we’ve experienced in recent years. It’s not the only headwind. But it’s one of several factors weighing on aggregate spending by consumers, businesses, and government. An aggregate-demand shortfall is something monetary policy can be, should be, and is addressing. Thank you.
# # #
End Notes
1. I would like to thank John Fernald, Fred Furlong, John Krainer, and Sam Zuckerman for assistance in the preparation of this presentation.
2. See Williams (2012).
3. One issue that I do not have time to cover is what caused the housing and associated credit bubble in the first place and what role monetary policy should have in combating bubbles. For further discussion of these issues, see Williams (2011a, b).
4. See, for example, Mian, Rao, and Sufi (2011).
5. See Gorton (2008).
6. See presentation materials by Williams (2005). See also Mishkin (2007) for a more detailed discussion of these issues and FRB/US model simulations.
7. See Crone and Clayton-Matthews (2005) and Stock and Watson (1989).
8. See, for example, Rudebusch (2009) and Chung et al. (2012).
9. See, for example, Reifschneider, Tetlow, and Williams (1999) and Boivin, Kiley, and Mishkin (2010).
10. Even conceptually, this concern doesn’t entirely vitiate the “do-more” conclusion. Suppose the central bank’s loss function is in terms of a weighted average of squared gaps across regions. If one area has a large negative gap then, when you square it, the loss is very costly. The central bank would then be willing to tolerate the opening up of modestly positive gaps in other regions in exchange for decreasing the very large negative gap.
11. Hancock and Passmore (2011) and Krishnamurthy and Vissing-Jorgensen (2011) find significant effects of MBS purchases. Stroebel and Taylor (2009), by contrast, do not.
12. See Board of Governors (2012) and Bernanke (2012).
References
Bernanke, Ben S. 2012. “Housing Markets in Transition.” Speech at the 2012 National Association of Homebuilders International Builders’ Show, Orlando, FL, February 10.
Board of Governors of the Federal Reserve. 2012. “The U.S. Housing Market: Current Conditions and Policy Considerations.” White paper, January 4.
Boivin, Jean, Michael T. Kiley, and Frederic S. Mishkin. 2010. “How Has the Monetary Transmission Mechanism Evolved Over Time?” Chapter 8 in Handbook of Monetary Economics 3.
Chung, Hess, Jean-Philippe Laforte, David Reifschneider, and John C. Williams. 2012. “Have We Underestimated the Likelihood and Severity of Zero Lower Bound Events?” Journal of Money, Credit, and Banking 44(s1, February), pp. 47–82.
Crone, Theodore M., and Alan Clayton-Matthews. 2005. “Consistent Economic Indexes for the 50 States.” Review of Economics and Statistics 87(4, November), pp. 593-603.
Feroli, Mike, Ethan Harris, Amir Sufi, and Ken West. 2012. “Housing, Monetary Policy, and the Recovery.” Presentation to the 2012 U.S. Monetary Policy Forum, New York, February 24.
Gorton, Gary. 2008. “The Panic of 2007.” In Maintaining Stability in a Changing Financial System, Proceedings of the 2008 Jackson Hole Economic Policy Symposium. Kansas City: Federal Reserve Bank of Kansas City.
Hancock, Diana, and Wayne Passmore. 2011. “Did the Federal Reserve’s MBS Purchase Program Lower Mortgage Rates?” Federal Reserve Board Finance and Economics Discussion Series 2011-01
Krishnamurthy, Arvind, and Annette Vissing-Jorgensen. 2011. “The Effects of Quantitative Easing on Interest Rates.” Brookings Papers on Economic Activity, forthcoming.
Mian, Atif, Kamalesh Rao, and Amir Sufi. 2011. “Household Balance Sheets, Consumption, and the Economic Slump.” Presentation at American Economics Association meetings, Atlanta, GA, January 8, 2012.
Mishkin, Frederic. 2007. “Housing and the Monetary Transmission Mechanism.” In Housing, Housing Finance, and Monetary Policy, Proceedings of the 2007 Jackson Hole Economic Policy Symposium. Kansas City: Federal Reserve Bank of Kansas City.
Reifschneider, David, Robert Tetlow, and John C. Williams. 1999. “Aggregate Disturbances, Monetary Policy, and the Macroeconomy: The FRB/US perspective.” Federal Reserve Bulletin (January), pp. 1–19.
Rudebusch, Glenn. 2009. “The Fed’s Monetary Policy Response to the Current Crisis.” FRBSF Economic Letter 2009-17 (May 22).
Stock, James H., and Mark W. Watson. 1989. “New Indexes of Coincident and Leading Economic Indicators,” NBER Macroeconomics Annual 1989(4), pp. 351–394.
Stroebel, Johannes C., and John B. Taylor. 2009. “Estimated Impact of the Fed’s Mortgage-Backed Securities Purchase Program.” NBER Working Paper 15626.
Williams, John C. 2005. “Monetary Policy Implications of a House Price Bubble.” Federal Open Market Committee presentation materials, Appendix 1, June 29.
Williams, John C. 2011a. “Monetary Policy and Housing Booms.” International Journal of Central Banking 7(1, March), pp. 345–354.
Williams, John C. 2011b. “Monetary Policy in an Era of Crises.” Presentation to the International Monetary Fund Annual Research Conference, Washington, DC, November 11.
Williams, John C. 2012. “The Federal Reserve and the Economic Recovery.” Presentation to the Bishop Ranch Forum, San Ramon, CA, February 8.