


New data covering the period since May 2023 have continued to follow the path of a nonlinear Phillips curve that shows the relationship between inflation and a particular measure of labor market slack, the ratio of the unemployment rate to the job vacancy rate. This new evidence provides additional support to the findings in our earlier Economic Letter, “Reducing Inflation along a Nonlinear Phillips Curve” (Crust, Lansing, and Petrosky-Nadeau 2023).
In this brief update, we examine how data received since the Letter’s publication align with the patterns predicted by the fitted nonlinear Beveridge and Phillips curves.
Updated data on labor market slack and inflation
Our earlier Letter uses data from January 1999 through May 2023 to bring the Beveridge and Phillips curves together in a novel way that provides insight into the relationship between inflation and labor market slack.
This update provides an out-of-sample test of whether the estimated relationship between job vacancies and unemployment—the Beveridge curve—and the relationship between inflation and labor market slack—the Phillips curve—have remained stable. Indeed, the new data align closely with the original fitted curves.
How well do labor market updates align with the Beveridge curve?
In May 2023, the unemployment rate was 3.7% while the job vacancy rate was 5.8%, yielding an unemployment-to-vacancy ratio of 0.64. A ratio below 1.0 implies a very tight labor market because the number of job vacancies exceeds the number of unemployed workers who could potentially fill those vacancies.
During the subsequent seven months, the unemployment rate fluctuated mildly but ended at 3.7% in December 2023. From May to December 2023, the U.S. economy created about 223,000 jobs on average per month. Over the same period, the job vacancy rate declined to 5.4%, yielding an unemployment-to-vacancy ratio in December 2023 of 0.69. The increase from 0.64 to 0.69 represents a modest rise in the amount of labor market slack.
Figure 1 updates our Beveridge curve data from the Letter. This version shows that the new data on unemployment and job vacancy rates for June 2023 through December 2023 (dark blue dots) have remained very close to the nonlinear Beveridge curve. That curve is constructed using data for the more normal labor market conditions that preceded the pandemic, from January 1999 to February 2020.
Figure 1
Fitted Beveridge curve relationship
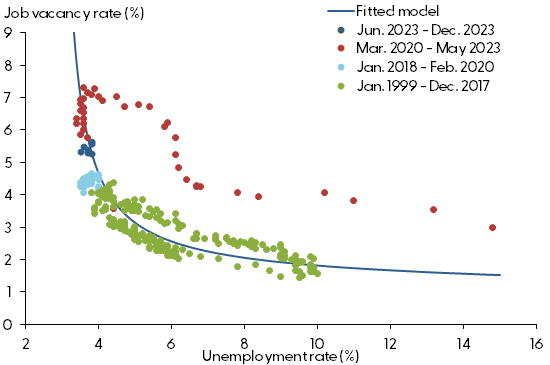
Source: Bureau of Labor Statistics and authors’ calculations.
How well do inflation updates align with the Phillips curve?
The 12-month core personal consumption expenditures (PCE) inflation rate in May 2023 was 4.68%. Note that these data are revised slightly from the original Bureau of Economic Analysis estimate used in our Letter. For the purpose of this update, we compare the new data to the Phillips curve constructed using data that were available at the time of publication. During the subsequent seven months, the inflation rate declined about 0.25 percentage point per month on average, ending in December 2023 at 2.93%. This represents a significant decline over a relatively short period of time.
Figure 2 updates our Phillips curve data from the Letter. This version shows that the new data on inflation and the unemployment-to-vacancy ratio (dark blue dots) continue to track closely along the steep part of the fitted nonlinear Phillips curve. This implies that a modest increase in labor market slack can coincide with a sizable decline in inflation. If these patterns continue, a successful soft landing from high inflation can be achieved for the U.S. economy.
Figure 2
Fitted nonlinear Phillips curve relationship
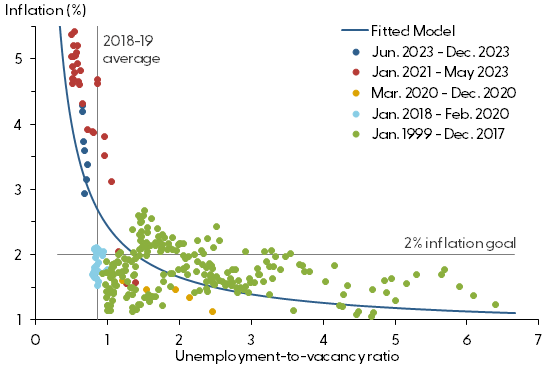
Source: Bureau of Labor Statistics, Bureau of Economic Analysis, and authors’ calculations.
Reference
Crust, Erin E., Kevin J. Lansing, and Nicolas Petrosky-Nadeau 2023. “Reducing Inflation along a Nonlinear Phillips Curve.” FRBSF Economic Letter 2023-17 (July 10).
The views expressed here do not necessarily reflect the views of the management of the Federal Reserve Bank of San Francisco or of the Board of Governors of the Federal Reserve System.